High Volume Penny Stocks (Filter Penny Stocks Using Marketxls)
")
Meet The Ultimate Excel Solution for Investors
- Live Streaming Prices Prices in your Excel
- All historical (intraday) data in your Excel
- Real time option greeks and analytics in your Excel
- Leading data in Excel service for Investment Managers, RIAs, Asset Managers, Financial Analysts, and Individual Investors.
- Easy to use with formulas and pre-made sheets
They say, the more risk you are willing to take the more will be the reward. This is true in the case of penny stocks. You might have heard of the term at least once. If you are new to the stock market and intend to stick around for long, it would do you good to know about penny stocks and certain factors to keep in mind while trading penny stocks. First, let’s understand what penny stocks are.
Penny stocks
The first thing that comes to my mind when I think about penny stocks is that they are very minimally priced. Typically, A penny stock refers to the stock of a small company that trades for less than $5 per share (earlier this involved stocks less than $1 per share but this definition was revised by the SEC). These are basically offered by companies with lower market capitalisation. Most of these stocks trade via OTC (over the counter) transactions or through the electronic OTC Bulletin Board (OTCBB) or through the privately-owned OTC Markets Group, with the exception of some trading at large exchanges like the New York Stock Exchange (NYSE).
A penny stock, like any other publicly traded stock, is created through a process called an IPO (initial public offering). To be listed on the OTCBB the company must first file a registration statement with the SEC or file stating the offering qualifies for an exemption from registration. It must also check state securities laws in the locations it wishes to sell the stock. Once approved, the company may begin the process of soliciting orders from interested investors. Finally, the company can apply to have the stock listed on a larger exchange, or it can trade OTC i.e., over-the-counter market.
This is one of those securities that not a lot of people know about, courtesy to the high risk these securities entail. The risk factor here is added due to many factors at play here. In this article I will be talking specifically about trade volumes and how they affect the risk and potential return on penny stocks. Also, I will be explaining how you can get the data on penny stocks with high trade volumes using MarketXLS platforms.
Illiquidity
The biggest reason for the risk here is that a lot of these stocks are not liquid. Why so? Its mainly because of the low trade volume. Put in simple words, due to the less exchange of hands on these stocks its becomes difficult to sell these stocks once they have been purchased.
Low liquidity levels also can lead to stock price manipulation. Let me put a scenario in front of you, Supposedly say a big trader sees this opportunity and buys a large chunk of stocks. Now this will push the stock price up. Seeing this, the small individual traders might see this as an opportunity to make profits by riding the wave (because both the %change in price is increasing and trade volume of stock is also going up). A lot of individual investors will follow the pursuit. Now, the big investor after registering profits will close his position, thereby selling his chunk of stocks to new investors. The small investors don’t see it coming and as a result buy these new stocks (the ones dumped by the big investor). Once the market realizes there was no fundamental reason for the stock to rise, investors rush to sell. This creates panic in the market because now sellers are comparatively more than buyers. As a result the stock price plummets leading to huge losses incurred by the small investors.
One of the most famous example of the pump & dump scheme is the Zirk de Maison case. de Maison and the other defendants conspired to defraud investors and potential investors in several public issuers, including Kensington Leasing Ltd., Lenco Mobile, Casablanca Mining, Ltd., Lustros, Inc., and Gepco Ltd., (the manipulated companies), by issuing millions of shares to themselves at little or no cost and then artificially controlling the price and volume of traded shares by, among other means, paying undisclosed commissions to brokers, former brokers, and boiler-room operators and promoters, for soliciting investors to make investments in, and fraudulently concealing the ownership interests of, the manipulated companies, according to court documents.
Little or no portion of the investments went to fund the operations of the manipulated companies. Rather, de Maison and the co-conspirators used most of the investments to enrich themselves, according to court documents.
This being said, not every penny stock has to be a scam. With certain measures and caution, one can always trade them without falling for the trap. the SEC recommends that investors heed the following warning signs: SEC trading suspensions, spam, large assets but small revenues, financial statements containing unusual items in the footnotes, odd auditing issues, and large insider ownership.
Moving on, lets understand how we can filter high vol penny stocks using marketXLS platform with a step by step approach.
Step 1
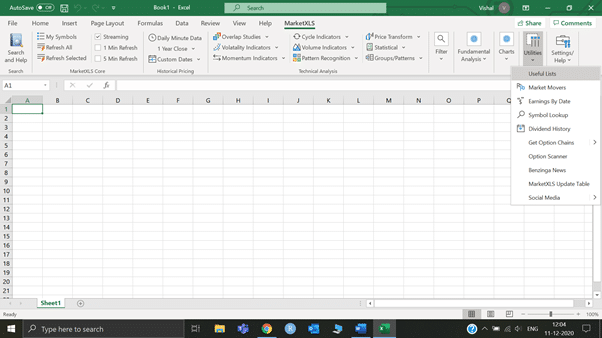
Open a new excel sheet and go to the MarketXLS tab and click on it. After that go to the utilities section and in the dropdown, click on “useful lists”
Step 2

In the useful list, click on “stocks under $5”. This will load the penny stocks data on your excel sheet.
Step 3
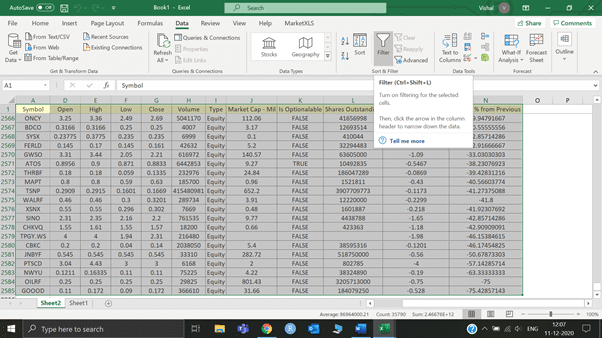
To filter the data, select the cells filled with data and then go to the Data Tab and in the “sort and filter” subsection click on “Filter”.
Step 4
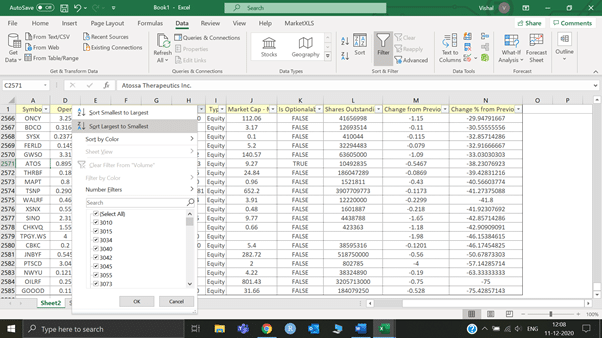
You will now see that the Volume head will have a dropdown list. In it choose “sort largest to smallest” to show volume data is descending order.
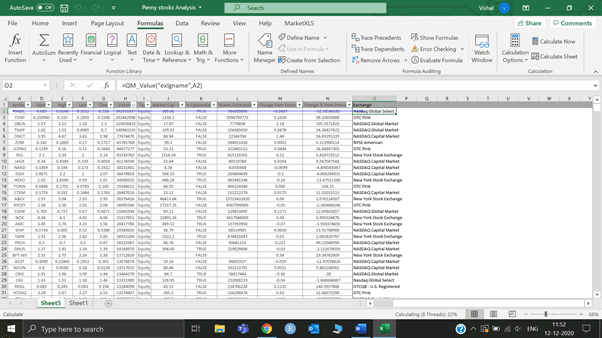
Extra tip: if you want to see the exchange on which the penny stocks are listed you can simply type the function =qm_value(“exlgname”, reference cell with penny stock ticker data). For making this step clear, I have attached a snip from my excel sheet below.
With this, I wrap up the article. Hope that now you have understood as to how one can filter high volume penny stocks in excel using MarketXLS and get list of most active penny stocks.
None of the content published on marketxls.com constitutes a recommendation that any particular security, portfolio of securities, transaction, or investment strategy is suitable for any specific person.
The author is not offering any professional advice of any kind. The reader should consult a professional financial advisor to determine their suitability for any strategies discussed herein.
the article is written for helping users collect the required information from various sources deemed to be an authority in their content. The trademarks if any are the property of their owners and no representations are made
References
- https://www.samco.in/knowledge-center/articles/best-penny-stocks-to-buy-now-in-india/
- https://www.investopedia.com/articles/investing/060315/stocks-trade-volume-important.asp

I invite you to book a demo with me or my team to save time, enhance your investment research, and streamline your workflows.