Is A 60/40 Investment Portfolio Right for You?

Meet The Ultimate Excel Solution for Investors
- Live Streaming Prices Prices in your Excel
- All historical (intraday) data in your Excel
- Real time option greeks and analytics in your Excel
- Leading data in Excel service for Investment Managers, RIAs, Asset Managers, Financial Analysts, and Individual Investors.
- Easy to use with formulas and pre-made sheets
A portfolio consisting of 60% stocks and 40% bonds has been considered a safe and reliable option for a very long time. It’s been a rule of thumb for years, and now we will see why. The thought behind this distribution is that if the stock market tanks, the bond part of the portfolio would pick up the slack. Historically, it has been more appropriate for retired people, people nearing retirement, and people with moderate risk appetite. When it comes to the market, the only constant changes, each recession inevitably ends with a recovery, which leads to another rebound, which always ends in a crash. That’s the nature of the economic cycle. What’s important to keep in mind is that the dips tend to be much briefer than the booms, and over the long term, markets always trend upwards.
A Short Overview on Bonds
Bonds are fixed-income securities used by companies, states, and sovereign governments to finance their projects and operations.
Bonds are less volatile, less risky than stocks, and can offer more stable and consistent returns if held till maturity. Their interest rates tend to be higher than rates at the bank on CDs or in money market accounts. They provide steady and regular income and are used for future retirement and education plans.
A Short Overview Of Stocks
The stock market trades in equity securities such as stocks, futures, options, and swaps. It’s primary function is to bring buyers and sellers together and ensure that trade happens in a uniform and regulated manner.
Two components of the stock market are the primary and secondary markets. The primary market is for the equities being run for the first time-initial public offerings, and the secondary market exists for the trading of pre-existing securities.
Pros of a 60/40 Portfolio
Historical returns of stocks and bonds:
The following six charts will show the performance of stocks and bonds over the last 90 years. Charts would show their historical performances individually and together i.e, if stocks and bonds were invested together.
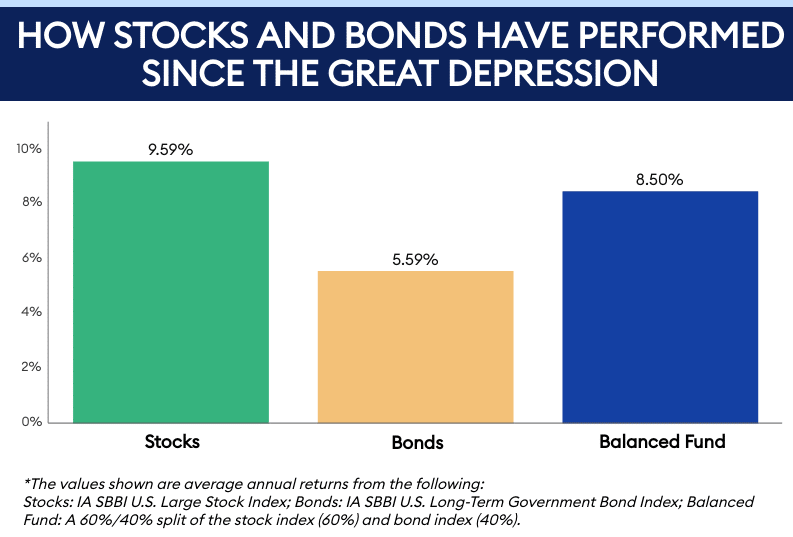
Historical Stock Returns after the Great Depression
The great depression was a worldwide economic depression that took place mainly in the 1930s. As a result, unemployment in the US rose to about 22%, and it was about 33% in other countries.
It began with a dip in stock prices on September 4, 1929, and became worldwide news as a stock market crash around October 29, 1929. But they recovered. It would have taken about seven years to fully recoup your money if invested in the US index fund.
In the years since, stocks have averaged 9.59% annual returns, Which’s more than 40% more than bonds’ average annual returns and over 10% higher than a balanced portfolio of both stocks and bonds.
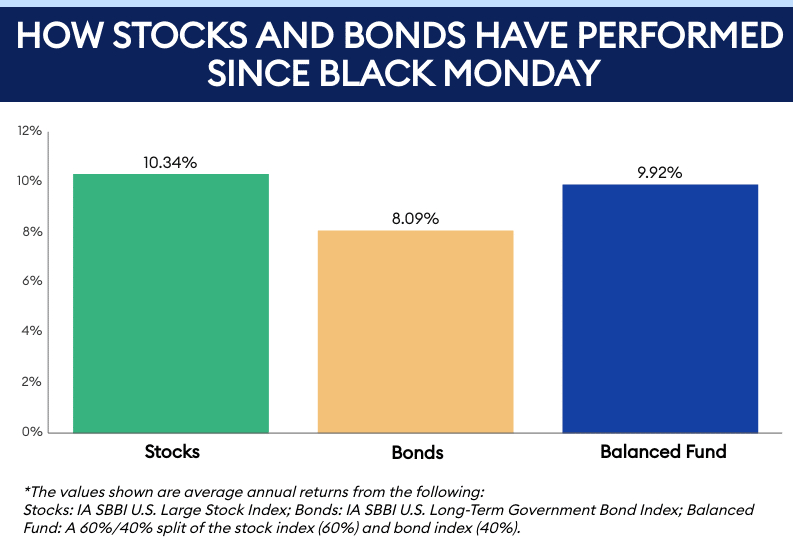
Historical stock returns after the Black Monday
On Monday, October 19, 1987, indexes like S&P500 and Dow Jones Industrial Index fell more than 20%. Brokers from New York, London, Tokyo, and just about any other city looked at their digital screens with a sinking dread.
It took about four years to recover, and the nation did not fall into depression, as was suspected.
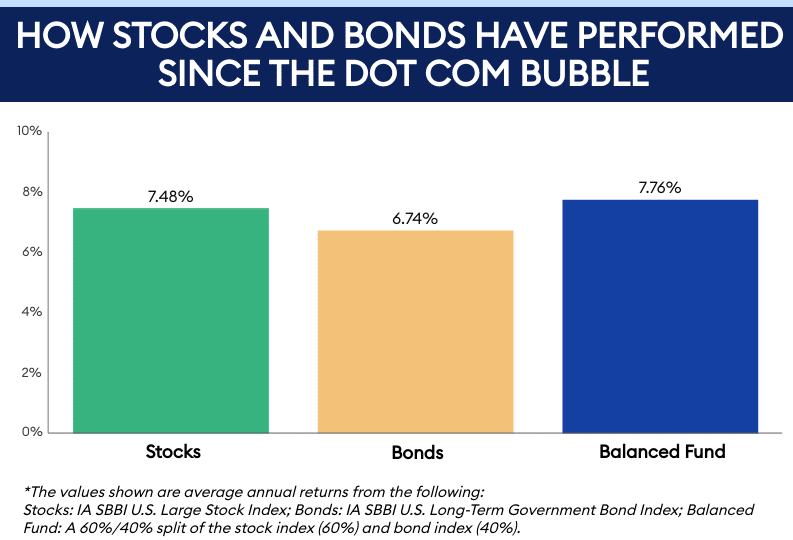
Historical Stock Returns After the Dot Com Bubble
According to Wikipedia, the stock market bubble was caused by excessive speculation of internet-related companies when a massive growth in the use and adoption of the internet was seen.
The Nasdaq index saw a growth of 400% from 1995 to 2000, only to fall by 78% from its peak by October 2002. The technology-heavy composite, which saw its peak in March 2000, gave up all its gains due to the bubble and did not recover for the better part of 15 years.
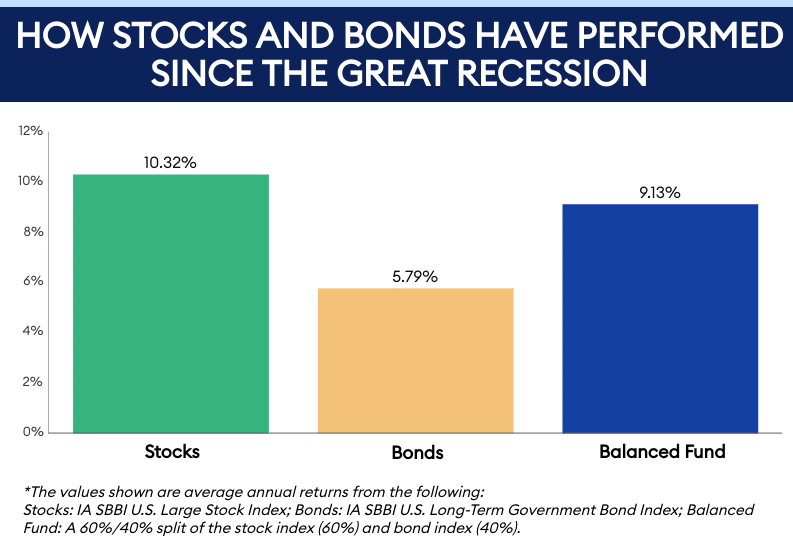
Historical stock returns after the Great Recession
After the Great Depression, the Great Recession, the worst economic downturn, was a period of decline of national economies globally, and it occurred between 2007 and 2009.
It would be years before recovery, but it grew into the longest bull market in history once the upswing took hold.
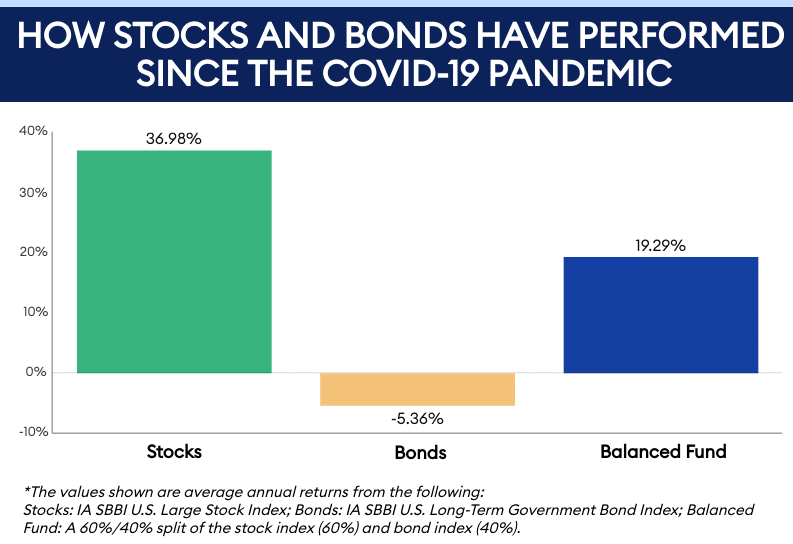
Historical stock returns after the Covid-19 Pandemic
Think back to March 2020, when covid hit, people couldn’t step out of their houses, curfews were implied, thousands of people were laid off, and millions lost their lives after fighting bravely in hospitals. It was a devastating year, and no one would have thought that people would end their year with a 16% higher portfolio.
As the vaccines started rolling out, investors were optimistic that the economy would recover, and recover it did.
It’s essential to view this last data point with context. It only accounts for about one year of returns, while the others in this set cover at least a decade. The current performance of stocks is exceptional, and years like these help contribute to the approximate 10% long-term annual average returns stocks enjoy.
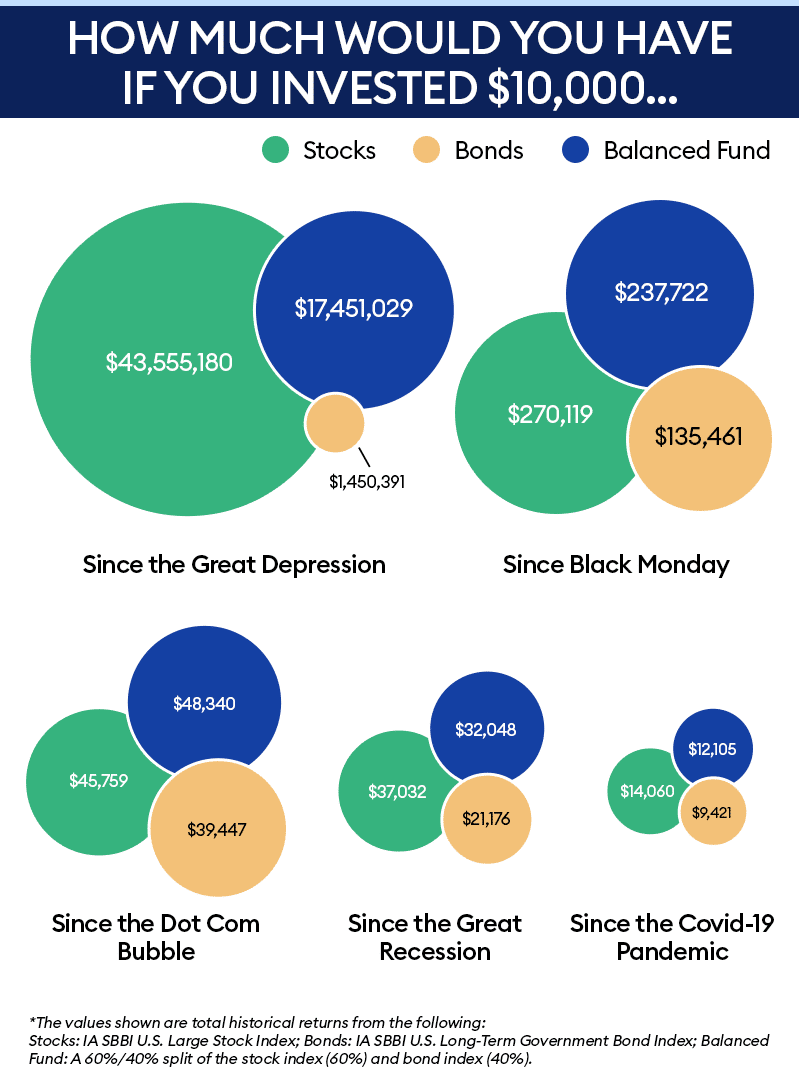
How Much You’d Have Today If You Invested $10,000
These numbers will show what a person would’ve gotten if they would’ve stayed invested all these years. , The key is to be patient through all the lows and not enter the market with the expectation of only experiencing the highs.
Cons Of A 60/40 Portfolio
Theoretically, bonds and stocks don’t move alongside each other.
If someone retires during a broad equity market downturn, they can sell their bond holdings and sell stocks later, whenever the rates get favorable. If they sell their stocks, they’re locking in stock portfolio losses which may take years to recover.
Low-interest rates coupled with newly emerging bear markets in 2000 dampened the popularity of this investing strategy. Experts are now stating that a well-diversified portfolio must have classes of assets other than stocks and bonds.
After the late 1990s dot com boom, many investors started questioning themselves as the stocks raced higher. As a result, they started seeing no point in investing 40% of their investable funds in bonds.
Bob Rice, the Chief Investment Strategist for a boutique investment bank, Tangent Capital, spoke about alternative investments at the fifth annual Investment News conference. He listed several reasons why the 60/40 portfolio doesn’t work efficiently: high equity valuations, increased risk in bonds, and low prices in the commodities market. In addition, digital currencies like bitcoin and ethereum that came into being due to the explosion of digital technology are another central area of interest and have diverted attention from stocks and bonds.
“You cannot invest in one future anymore; you have to invest in multiple futures,” Rice said. “The things that drove 60/40 portfolios to work are broken. The old 60/40 portfolio did the things clients wanted, but those two asset classes alone cannot provide that anymore. It was convenient, it was easy, and it’s over. We don’t trust stocks and bonds completely to do the job of providing income, growth, inflation protection, and downside protection anymore.”
He also encouraged investors to look at alternate investments like master limited partnerships, royalties, and debt instruments instead of bonds.
Bottom Line
The 60/40 works out in some cases and is a safer option if a person is looking to retire soon since the volatility of stock markets can pose a risk. On the other hand, bonds have historically been a safer option and can be used in times of fund requirements in case of stock market downturns. Thus, the 60/40 mix of stocks and bonds have yielded superior returns in some cases while having limitations in some. But several advisors have started reverting to investments in other assets to achieve long-term growth with reasonable risk.
References
https://www.forbes.com/advisor/investing/stock-and-bond-returns/
Image References
https://www.forbes.com/advisor/investing/stock-and-bond-returns/

I invite you to book a demo with me or my team to save time, enhance your investment research, and streamline your workflows.