")
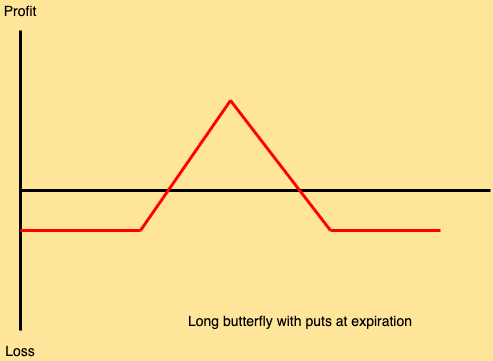
A long butterfly option with puts consists of two short puts at the middle strike and one long put, each at a lower and a higher strike price. The upper and lower strikes(wings) must be equidistant from the middle strike(body), and all the options must have the same expiration.
This strategy is used when investors are looking for the underlying stock to achieve a specific target price at expiration. This strategy is established for a net debit, and the profit potential and maximum risk are limited. The long butterfly is an advanced strategy because the profit potential is small compared to the cost of the strategy. Since there are three strike prices and three bid-ask spreads, there are multiple commissions that the trader must pay. It thus becomes essential for the trader to open and close the long butterfly position at reasonable prices to ensure that the risk/reward ratio is favourable.
Let us see how we can use the MarketXLS template to understand long butterfly with puts:
In the template:
* Mention the stock ticker
* Enter the expiry date of the option. A list of upcoming expiry dates has been provided adjacent to the input.
* Enter the ATM strike price
* Enter the spread (the difference between higher and lower strike price)
* Enter the upper and lower expiry price in the cell D28:D29 in the template
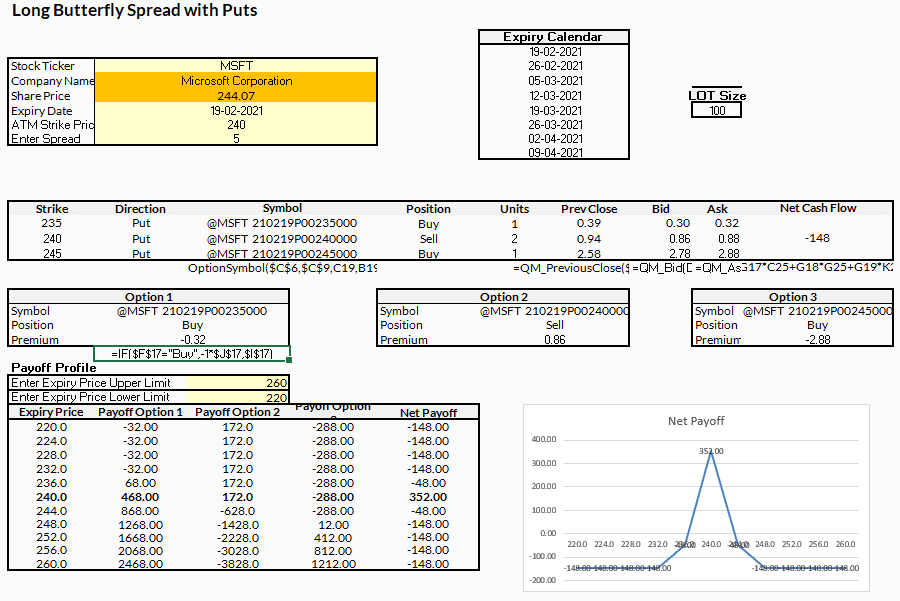
In this example, we consider Microsoft Corp (MSFT) having a share price of $244.07. The investor enters the ATM strike price of $240 with a spread of 5 and the expiry date on 19-02-2021. The template calculates the bid-ask spread for all three put options with strike prices of $235, $240, and $245. The net cash flow from this strategy is (-)$148.
Maximising profits
The maximum profit that can be achieved by playing this strategy is equal to the difference between the highest and the centre strike prices less the net cost of the position (including commissions). This profit is only realised if the stock price is equal to the strike price of the centre strike (short put) at expiration.
Risk potential
The maximum loss that can be realised is the net cost of the strategy (including commissions). The trader may face the maximum loss in two cases. Firstly, if the stock price is above the highest strike price at the time of expiration, all the puts expire worthlessly, and the loss becomes the cost of the strategy. Secondly, if the stock price is below the lowest strike price at the time of expiration, all the puts are “in-the-money,” and the net value of the butterfly spread is zero at expiration, and maximum loss is realised.
Breaking even
The long butterfly strategy has two breakeven points. The upper breakeven point occurs when the stock price is equal to the highest strike price at expiration, and the lower breakeven point occurs when the stock price is equal to the lowest strike price at expiration.
When to use this strategy
The long butterfly with puts can be thought of as a neutral or moderately bearish strategy. If the underlying asset’s stock price is near the centre strike price when the position is first established, then the underlying market forecast should be for “neutral” price action. If the stock price is above the centre strike price when the position is established, then the forecast must be for the stock price to fall to the level of the strike price and hence calls for bearish price action. This strategy has a low entry cost, which means a lower risk if the market acts unfavourably, but it can be challenging to lock down that pinning strike. The long butterfly spread with puts is good to use in low volatile markets, where the price has a high probability of pinning. However, it can also be a right choice in unpredictable markets due to its limited loss, but traders should keep a close eye on the trade and close it out once the stock moves to the short strikes.
Understanding the market forecast
Change in stock price:
Long butterfly options have a delta that is zero or very close to zero, regardless of the time to expiration or stock price. The long butterfly does not profit much from stock price changes. Instead, it profits from time decay when the stock price lies between the highest and lowest strike prices.
Change in volatility:
Long butterfly spreads with puts have a negative vega, meaning that the price of the long butterfly falls with a rise in volatility. When volatility falls, the price of the option rises, and profits are made. Long butterfly spreads should be purchases when the market forecast is that volatility will decline.
Impact of time:
A long butterfly spread with puts has a positive theta when the stock price ranges between the lowest and highest strike prices. However, if the stock price moves out of this range, the theta becomes negative as expiration approaches.
The bottom line
The long put butterfly spread is created by buying one put with a lower strike price, selling two at-the-money puts, and buying a put with a higher strike price. Net debt is created when entering the position. Like the long call butterfly, this position has a maximum profit when the underlying stock price stays at the strike price of the middle options. While it is an advanced strategy, the limited risk potential is beneficial. The templates provided by MarketXLS are easy to use and can help you track your options with ease.
Disclaimer
None of the content published on marketxls.com constitutes a recommendation that any particular security, portfolio of securities, transaction, or investment strategy is suitable for any specific person. The author is not offering any professional advice of any kind. The reader should consult a professional financial advisor to determine their suitability for any strategies discussed herein. The article is written for helping users collect the required information from various sources deemed to be an authority in their content. The trademarks if any are the property of their owners and no representations are made.
References
https://www.optionseducation.org/strategies/all-strategies/long-put-butterfly
