Long Strangle Option Strategy (Using Excel Template)
")
Meet The Ultimate Excel Solution for Investors
- Live Streaming Prices Prices in your Excel
- All historical (intraday) data in your Excel
- Real time option greeks and analytics in your Excel
- Leading data in Excel service for Investment Managers, RIAs, Asset Managers, Financial Analysts, and Individual Investors.
- Easy to use with formulas and pre-made sheets
A long strangle is a neutral strategy that involves simultaneously buying a slightly out of the money put option (having a lower strike price) and a slightly out-of-the-money call option (having higher strike price) of the same underlying asset and same expiration date. Long strangle strategies are debit spreads because a net debit is required to enter the trade. It is established for a net debit and profits if the underlying stock price rises above the upper breakeven point or falls below the lower breakeven point.
The profit potential is unlimited, while the maximum loss is limited to the total cost of the strangle option.
Let us see how we can use the MarketXLS Template to understand the long strangle option strategy
In the template:
* Mention the stock ticker
* Enter the expiry date of the option. A list of upcoming expiry dates has been provided adjacent to the input.
* Enter the OTM strike price for the put and call option.
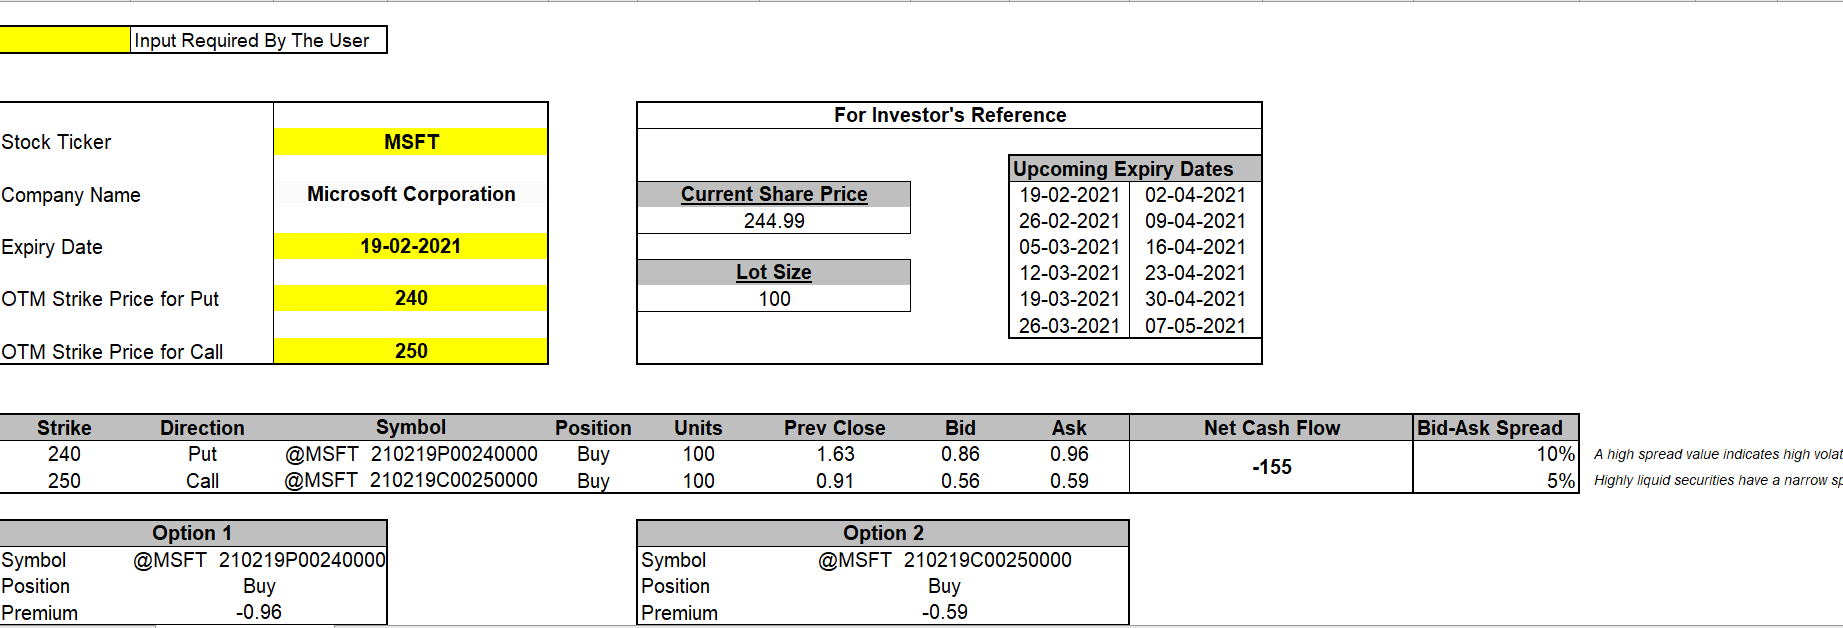
Consider Microsoft Corp. (MSFT). In this example, we have chosen the expiry date to be 19/02/2021. The OTM strike price for put and call options are $240 and $250, respectively.
The template then calculates the bid-ask spread and the net cash flow. A high bid-ask spread of 10% in the put option signifies high volatility, while a low spread of 5% in the call option signifies greater liquidity of the security.
Profits and Losses
Profit
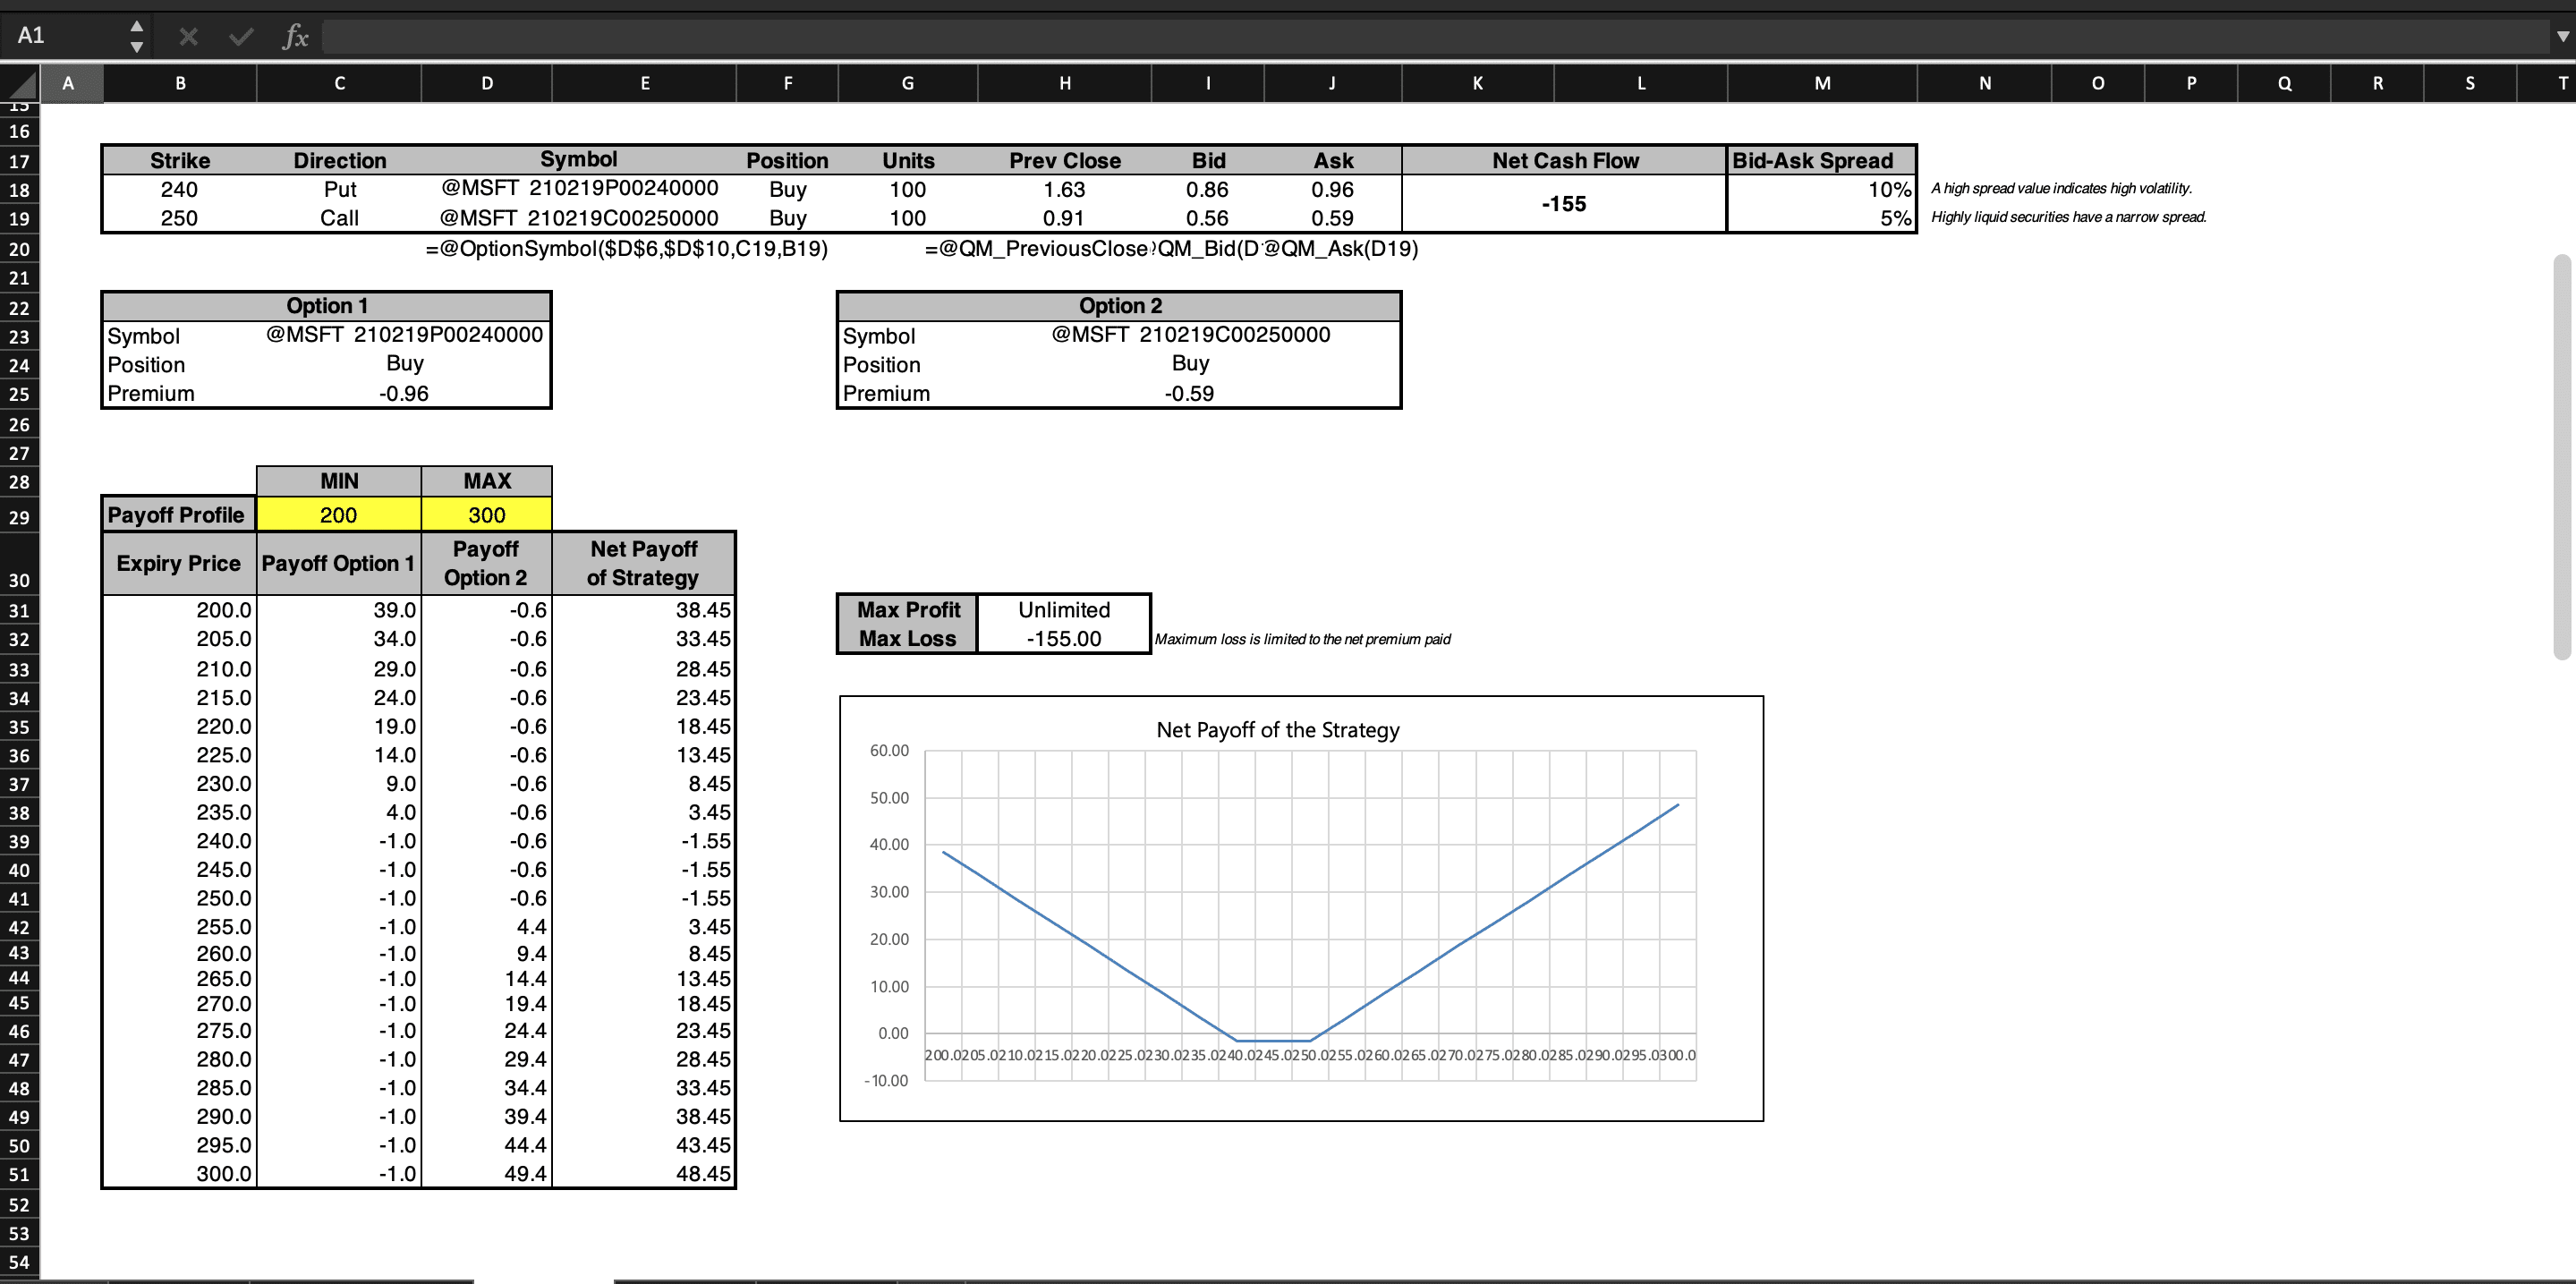
A long strangle option strategy is profitable when the price of the underlying asset rises above the upper breakeven point or falls below the lower breakeven point. Considerable gains are possible, which may be calculated using the following formulae:
• Maximum Profit = Unlimited
• Profit Achieved When Price of Underlying > Strike Price of Long Call + Net Premium Paid OR Price of Underlying < Strike Price of Long Put – Net Premium Paid
• Profit = Price of Underlying – Strike Price of Long Call – Net Premium Paid OR Strike Price of Long Put – Price of Underlying – Net Premium Paid
Risk
The maximum risk for a long strangle strategy is realised when the underlying stock price at expiration is between the strike prices of the options bought. In this scenario, both the call and put options expire worthlessly, and the trader loses his entire initial debit undertaken to enter the trade.
Breakeven
The long strangle strategy has two breakeven points which can be calculated using the following formulae:
• Upper Breakeven Point = Strike Price of Long Call + Net Premium Paid
• Lower Breakeven Point = Strike Price of Long Put – Net Premium Paid

Understanding the market forecast
Changes in stock price
When the stock price lies between the upper and lower stock prices, then the call option’s positive delta and the negative delta of the put option offset each other, so for small changes in prices between the strike prices, the strangle has a ‘near-zero delta.
If the stock price rises fast, the call increases in price more than the outfalls in price, and if the stock price falls fast, then the put rises in price more than the call falls. In this case, the strangle has a positive gamma. A positive gamma implies that the delta of a stock position changes in the same direction as the change in the underlying stock price.
Change in volatility
As volatility rises, the options price and the strangle’s price rise if factors like stock price and expiration time remain constant. When volatility increases, the price of long strangles increase, and they become more profitable, so they have a positive vega. A positive vega means that a position profits if the volatility rises and makes losses if the volatility falls.
Impact of time
Long strangles consist of two long options, so their sensitivity to time erosion or decay is higher than that of single option strategies. Thus, long strangles tend to incur more losses as time passes if the stock price doesn’t change.
The bottom line
The long strangle option strategy has some significant advantages. Firstly, the cost and maximum risk of one strangle is lower than that for one straddle. Secondly, for a fixed amount of capital, more strangles can be purchased. However, strangles are more sensitive to time decay than other strategies, and there is a greater chance of losing 100% of the strangle’s cost if it is held to expiration. The templates provided by MarketXLS are easy to use and can help you track your options with ease.
Disclaimer
None of the content published on marketxls.com constitutes a recommendation that any particular security, portfolio of securities, transaction, or investment strategy is suitable for any specific person. The author is not offering any professional advice of any kind. The reader should consult a professional financial advisor to determine their suitability for any strategies discussed herein. The article is written for helping users collect the required information from various sources deemed to be an authority in their content. The trademarks if any are the property of their owners and no representations are made.
References
https://www.fidelity.com/learning-center/investment-products/options/options-strategy-guide/long-strangle
Get Market data in Excel easy to use formulas
- Real-time Live Streaming Option Prices & Greeks in your Excel
- Historical (intraday) Options data in your Excel
- All US Stocks and Index options are included
- Real-time Option Order Flow
- Real-time prices and data on underlying stocks and indices
- Works on Windows, MAC or even online
- Implement MarketXLS formulas in your Excel sheets and make them come alive
- Save hours of time, streamline your option trading workflows
- Easy to use with formulas and pre-made templates

I invite you to book a demo with me or my team to save time, enhance your investment research, and streamline your workflows.