Seasonality & Historical Returns Template
Description
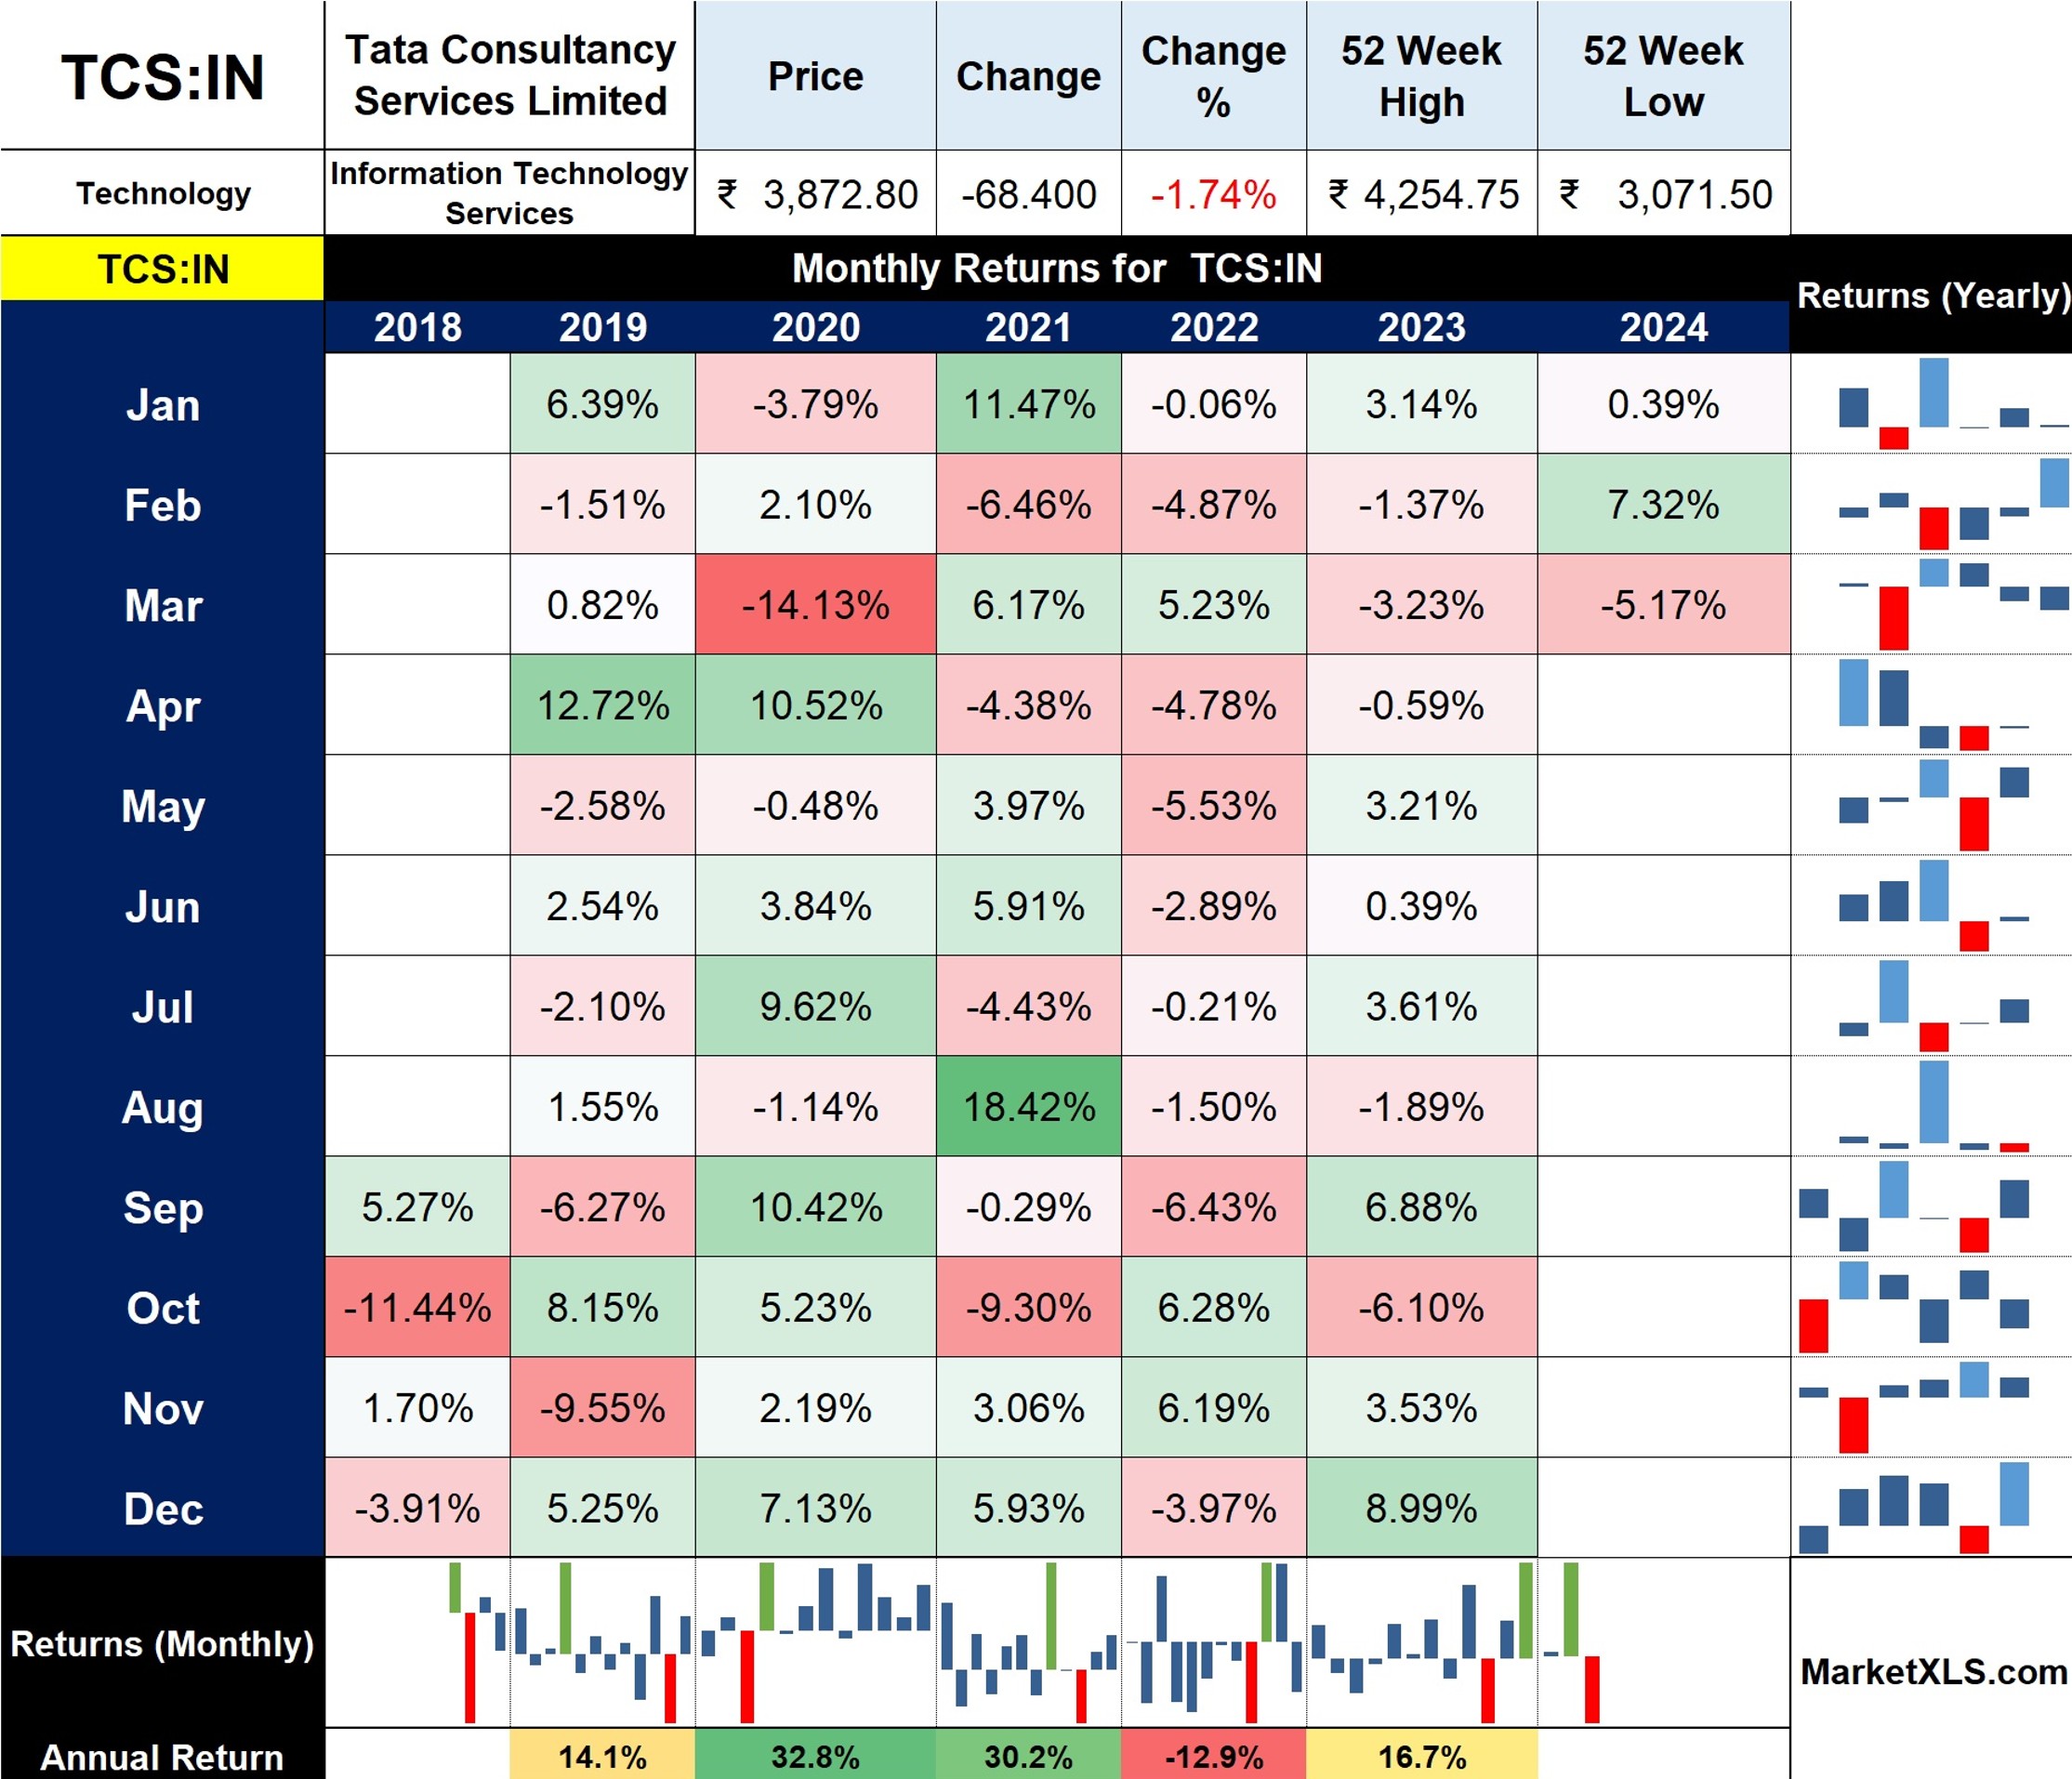
The Seasonality and Historical Returns Template is a tool designed to aid investors in discerning patterns and trends in the stock market. By presenting a structured overview of Stock Symbol's Monthly and Annual performance, this template becomes an indispensable resource for strategic investment planning and historical analysis.
Analyzing the Template
To maximize the utility of this template, follow these steps:
1) Monthly Returns Analysis:
Identify months that consistently show similar performance year-over-year, which might suggest seasonality effects.
2) Yearly Trends Visualization:
Utilize the bar and line charts to understand the yearly trend for each month. This visual representation can highlight volatility and stability in returns over the years.
3) Annual Performance Review:
Compare the horizontal bars at the bottom to evaluate annual returns at a glance. This helps in understanding the longer-term trajectory of the stock's performance.
4) Pattern Identification:
Look for patterns such as specific months that show strong positive or negative returns, which can be used to inform timing for investment decisions.
Use Case Scenario
Imagine you are an investor considering a position in TCS:IN. You would start by examining the historical performance displayed in the template:
1) Identifying Seasonal Strengths and Weaknesses:
By analyzing the monthly returns, you notice that TCS:IN has historically shown strong returns in August and weak performance in October. This can guide you to time your entry and exit from the stock around these months.
2) Strategic Investment Decisions:
The trend analysis provided by the yearly charts reveals that TCS:IN has shown an increasing annual return trend. This might encourage a long-term investment strategy.
3) Comparative Analysis:
You could enter different tickers into the template and use the 'Refresh All' feature to compare TCS:IN with its competitors, giving you a competitive edge in investment decisions.
Conclusion
The Seasonality and Historical Returns Template is more than just a static representation of past performance; it is a dynamic analytical tool that empowers investors to uncover hidden rhythms in the stock market. By facilitating a deeper understanding of temporal trends, this template enables both novice and experienced investors to make more informed and strategic investment choices.
Template Screenshots
Get Access to 1 Billion Usable Market data points IN YOUR EXCEL SHEETS WITH EASY TO USE EXCEL FUNCTIONS
Get started today
Similar Templates
No similar templates found