

Introduction
Navigating the world of trading can be complex, but understanding key concepts like Support and Resistance Indicators is crucial. Put simply, these indicators help traders spot price levels where an asset typically pauses or reverses. Mastering these tools can significantly enhance your trading strategy. Let’s dive into how you can effectively use support and resistance indicators to make smarter trading decisions.
What are Support and Resistance Indicators?
Support and resistance indicators are essential tools in trading. They help traders identify price levels where an asset tends to stop and reverse. Support is where a price decline pauses due to a concentration of buying interest. Resistance is the opposite, where upward price movement halts because of selling pressure. These indicators can be based on historical price data, psychological levels, or moving averages. Recognition of these levels helps traders make informed decisions about entry and exit points. They also assist in setting stop-loss orders and predicting future price movements. Understanding support and resistance is crucial for effective risk management.
How do I identify Support and Resistance Indicators?
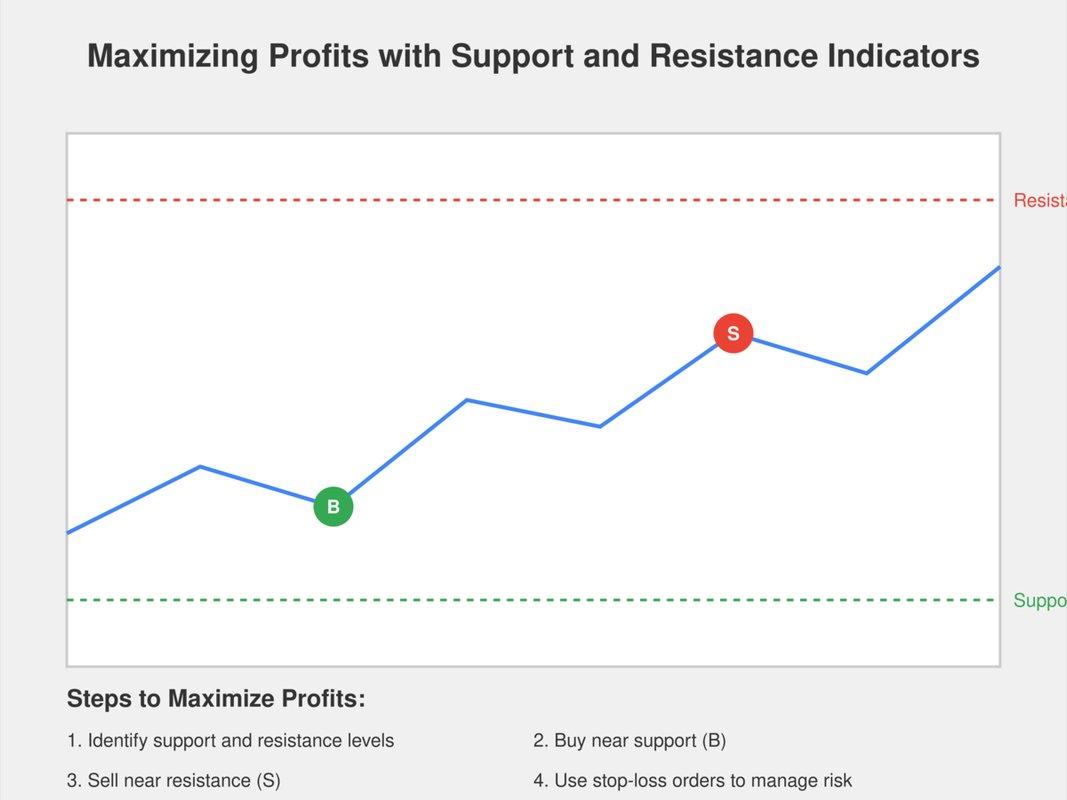
To identify support and resistance levels, I start by observing the price action on a stock chart. Look for price points where the stock consistently stops falling, which indicate support. Similarly, identify areas where the stock frequently stops rising, known as resistance. Use horizontal lines to mark these zones. Check historical data to see if these levels have been tested multiple times. Volume can also offer clues; high trading volume near these levels may confirm their significance. Finally, complement this analysis with technical indicators like moving averages or trend lines. This combination helps in accurately spotting support and resistance.
What is the Best Setting for Support and Resistance Indicators?
The best setting for a support and resistance indicator varies depending on your trading style and market conditions. For day traders, shorter time frames like 5-minute or 15-minute charts can offer more precise levels. Swing traders might prefer daily or 4-hour charts for identifying significant support and resistance zones. It’s essential to customize the indicator’s sensitivity to suit the volatility of the asset you are trading. Higher sensitivity can catch smaller price movements, but may produce more false signals. Lower sensitivity helps filter out noise but could miss minor price reversals. Always back-test your settings on historical data to validate their effectiveness before applying them in live trading. Adjustments may also be needed as market dynamics shift over time.
I usually use two charts for intraday trading: a 15-minute chart and a 3-minute chart.
How do I use MarketXLS to calculate Support and Resistance Indicators?
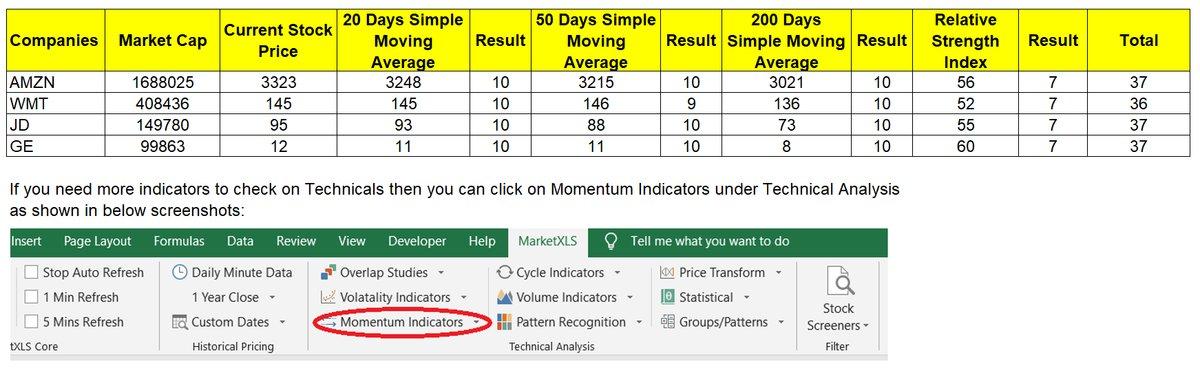
MarketXLS offers various functions to calculate Support and Resistance indicators, primarily through technical indicators such as Bollinger Bands, Moving Averages, and others. Here is a detailed guide on how to use MarketXLS for calculating these indicators:
Support and Resistance Indicator
Support1 : = =TechnicalIndicator("MSFT","Support1")
Support2 : = =TechnicalIndicator("MSFT","Support2")
Resistance1 : = =TechnicalIndicator("MSFT","Resistance1")
Resistance2 : = =TechnicalIndicator("MSFT","Resistance2")
MarketXLS offers two tiers of support and resistance indicators. Support1 indicates the initial support level, while Resistance1 signifies the first resistance level, and so forth.
I use MarketXLS support and resistance indicators to display these levels in my Excel sheet where I track my trades. I calculate these using historical OHLC prices. I checked the results produced by MarketXLS against various other leading market info providers like Barchart.com, and the numbers match perfectly.
Bollinger Bands
Bollinger Bands are a type of statistical chart characterizing the prices and volatility over time. They consist of a middle band (SMA), an upper band, and a lower band.
– **Upper Bollinger Band **: =TechnicalIndicator("MSFT","BBANDSU")
– Middle Bollinger Band: =TechnicalIndicator("MSFT","BBANDSM")
– Lower Bollinger Band: =TechnicalIndicator("MSFT","BBANDSL")
You can also specify the period:
– Upper Bollinger Band for past 6 periods: =TechnicalIndicator("MSFT","BBANDSU","6")
– Middle Bollinger Band for past 6 periods: =TechnicalIndicator("MSFT","BBANDSM","6")
– Lower Bollinger Band for past 6 periods: =TechnicalIndicator("MSFT","BBANDSL","6")
Moving Averages
Moving Averages smooth out price data to create a single flowing line, making it easier to identify the direction of the trend.
– ** Simple Moving Average (SMA)**:
– **20-day SMA **: =SimpleMovingAverage("MSFT",20)
– **30-day SMA **: =SimpleMovingAverage("MSFT",30)
– ** Exponential Moving Average (EMA)**:
– **30-day EMA **: =ExponentialMovingAverage("MSFT",30)
– **20-day EMA **: =ExponentialMovingAverage("MSFT",20)
Mid Point Over Period
This function calculates the average stock price over a specified period.
– **14-day Mid Point **: =MidPointOverPeriod("MSFT",14)
– **20-day Mid Point **: =MidPointOverPeriod("MSFT",20)
Additional Technical Indicators
You can also use other technical indicators to estimate support and resistance levels.
– ** Negative Directional Indicator (minus DI)**: =TechnicalIndicator("MSFT","MINUS_DI", "14")
– ** Positive Directional Indicator (plus DI)**: =TechnicalIndicator("MSFT","PLUS_DI", "14")
– ** ADX (Average Directional Index)**: =TechnicalIndicator("MSFT","ADX", "14")
Example
Here’s a complete example of calculating the Bollinger Bands for Microsoft (MSFT):
=TechnicalIndicator("MSFT","BBANDSU", "20") ' Upper band for 20 days=TechnicalIndicator("MSFT","BBANDSM", "20") ' Middle band for 20 days=TechnicalIndicator("MSFT","BBANDSL", "20") ' Lower band for 20 days
How to use candlestick patterns to confirm support and resistance levels?
Candlestick patterns can be effective tools for confirming support and resistance levels. First, identify potential support or resistance lines using historical price data. Look for candlestick patterns, such as hammers or engulfing patterns, at these levels. These patterns suggest a potential reversal in price. For instance, a hammer at a support level indicates a possible upward move. Similarly, a bearish engulfing pattern near resistance suggests a downward move. Confirm these patterns with trading volume; increased volume strengthens the signal.
How does market sentiment impact support and resistance levels?
Market sentiment significantly influences support and resistance levels in financial markets. When the sentiment is bullish, traders are more likely to buy, pushing prices towards resistance levels. Conversely, bearish sentiment leads to increased selling, driving prices down to support levels. If the sentiment shifts dramatically, these levels can be breached more easily. Investors often use sentiment indicators to gauge the strength of support and resistance. Extreme optimism or pessimism can cause false breakouts. This volatility underscores the dynamic nature of market psychology.
Can Support and Resistance Indicators Predict Market Reversals?
Support and resistance levels are essential concepts in technical analysis. These levels can sometimes predict market reversals. Traders closely watch these levels to determine potential entry and exit points. When the price approaches a support level, it may bounce back upward. Conversely, nearing a resistance level might lead to a price drop. However, support and resistance are not foolproof indicators. Market conditions and external factors can influence price movements. It’s crucial to combine these levels with other analysis tools. Relying solely on support and resistance can be risky. Overall, they offer valuable insights but require cautious use.
How do I adjust support and resistance levels in different market conditions?
Adjusting support and resistance levels in different market conditions involves both technical analysis and understanding market sentiment. In a trending market, support and resistance levels tend to move in the direction of the trend. You can use moving averages to identify these dynamic levels. In a volatile market, levels might frequently breach and then return, so it’s crucial to focus on more recent data points. For consolidating markets, horizontal support and resistance lines drawn from past peaks and troughs are more useful. Always take into account the volume of trades, as higher volumes at specific price levels often emphasize the importance of those levels. Adapting to these varying conditions requires regular review and adjustment of your initial levels.
How to identify false breakouts of support and resistance levels?
To identify false breakouts of support and resistance levels, it’s crucial to observe the volume accompanying the breakout. A genuine breakout often sees significant volume, indicating strong buying or selling interest. Conversely, a false breakout usually has low trading volume, suggesting a lack of commitment. After the breakout, watch for a retest of the previous support or resistance level. If the price fails to hold or quickly reverses, it might indicate a false breakout. Additionally, using technical indicators like RSI or MACD can help confirm whether the momentum supports the breakout. Be wary if these indicators show divergence. Lastly, considering the broader market context and news events can also provide clues about the breakout’s validity.
How Do I Use Fibonacci Retracements to Confirm Support and Resistance Levels?
To use Fibonacci retracements to confirm support and resistance levels, begin by identifying a significant price move, either upward or downward. Plot the Fibonacci retracement tool from the start of the move to the end. The tool will generate key levels, typically at 23.6%, 38.2%, 50%, 61.8%, and 78.6% of the price range. Traders watch these levels to anticipate potential support or resistance, as prices often retrace to these points before continuing in the original direction. For confirmation, look for additional signals, such as candlestick patterns or volume spikes. Combining Fibonacci levels with other technical indicators enhances the reliability of the analysis. This multi-faceted approach increases confidence in making trading decisions.
How Do I Combine Moving Averages with Support and Resistance for Better Trade Entries?
Combining moving averages with support and resistance levels can be an effective strategy to enhance your trading entries and exits. Here’s a step-by-step approach to do so using MarketXLS functions:
1. Calculate Moving Averages
MarketXLS provides several functions to calculate different types of moving averages:
• Simple Moving Average (SMA):**
– SimpleMovingAverage(symbol, days): Calculates the SMA for a given number of days.
– Example: =SimpleMovingAverage("MSFT", 50) – This gives the 50-day SMA for Microsoft.
• Exponential Moving Average (EMA):**– ExponentialMovingAverage(symbol, days): Calculates the EMA for a given number of days.
– Example: =ExponentialMovingAverage("MSFT", 50) – This gives the 50-day EMA for Microsoft.
These functions enable you to track short-term and long-term trends. For instance:
– Short-term trend: 20-day MA
– Long-term trend: 200-day MA
2. Identify Support and Resistance Levels
Support and resistance levels indicate where the price tends to find a floor (support) or a ceiling (resistance). These levels can be found using various methods, including historical price levels, Fibonacci retracements, and pivot points.
You can use simple techniques to find support and resistance manually by looking at:
– Previous price lows (support)
– Previous price highs (resistance)
Alternatively, MarketXLS provides advanced technical indicators which can automatically help identify these levels based on historical data analysis.
3. Combining Both
Here’s how to combine moving averages with support and resistance:
1.**Trend Confirmation:**Use moving averages to determine the market trend. For instance, if the current price is above the 200-day MA, it indicates a bullish trend.
2.** Entry Points:**– Bullish Entry: Enter a trade when the price is near a support level and the short-term MA crosses above the long-term MA.
– Bearish Entry: Enter a trade when the price is near a resistance level and the short-term MA crosses below the long-term MA.
3.** Exit Points:**
– In a bullish trade, consider exiting when the price nears a resistance level or if the short-term MA crosses below the long-term MA.
– In a bearish trade, consider exiting when the price nears a support level or if the short-term MA crosses above the long-term MA.
Example Strategy:
1. Calculate the 20-day and 50-day EMAs using MarketXLS:
=ExponentialMovingAverage("MSFT", 20)=ExponentialMovingAverage("MSFT", 50)
2. Identify key support and resistance levels manually or using technical analysis tools.
3. Combine these indicators to make informed buy/sell decisions:
– Buy Signal: When the 20-day EMA crosses above the 50-day EMA near a support level.
– Sell Signal: When the 20-day EMA crosses below the 50-day EMA near a resistance level.
MarketXLS Utility Functions:
To get historical data and perform backtesting, you can use functions like:
– history functions to get historical prices.
– StandardDeviation for volatility analysis.
By properly combining moving averages with support and resistance levels, you can enhance the accuracy of your trades and improve your overall trading strategy effectiveness .
Here is the template you might want to checkout and MarketXLS has 100s of templates to get you started easily and save you time:
Support and Resistance Indicators
Summary
The article explains how Support and Resistance Indicators help traders identify price levels where assets typically pause or reverse. It details how to spot these levels using stock charts, historical data, and volume. Different settings for day traders and swing traders are discussed. MarketXLS tools, like Bollinger Bands and Moving Averages, are illustrated to calculate these indicators. Combining candlestick patterns, market sentiment, and technical indicators can confirm support and resistance. Techniques for adjusting levels in varying market conditions are covered. The article also explains using Fibonacci retracements and combining moving averages with support and resistance for better trade entries.
Support and Resistance Indicators
Support and Resistance Indicators
