Murphy Technology Screen (Stock Screener-Excel Template)
")
Meet The Ultimate Excel Solution for Investors
- Live Streaming Prices Prices in your Excel
- All historical (intraday) data in your Excel
- Real time option greeks and analytics in your Excel
- Leading data in Excel service for Investment Managers, RIAs, Asset Managers, Financial Analysts, and Individual Investors.
- Easy to use with formulas and pre-made sheets
Technology has a significant impact on our lives and has changed our daily life and work functions. We are at a stage where envisioning life without technology is hard to imagine. The technology sector has been a driver who has been creating new infrastructures, jobs, and wealth sources while destroying old ones.
John J. Murphy says that the technology sector is the fastest-growing and will quickly dominate all other sectors in terms of size. It is a sector with various industry groups and is becoming very diversified, but the market has not yet recognized it. He believes that most of the investors are underinvested in this sector. This lack of coverage provides them with an excellent opportunity to buy the technology companies with significant growth potential at very reasonable—and sometimes low—prices.
The Murphy Technology Screener
This screener attempts to recognize tech stocks with high research and development (R&D) expenditures as a percentage of sales, high pre-tax margins, and equity return. Top-line solid sales growth is also selling at attractive values as measured by “growth flow.” Murphy prefers to follow companies and not purchase at any price but buy when valuations are attractive. Traditional valuation techniques may be misleading for technology stocks. Hence, Murphy uses R&D spending to earnings per share as one factor in his screen to determine what he calls a company’s growth flow. He uses the growth flow to value the underlying stock.
Screening Stocks using MarketXLS Template
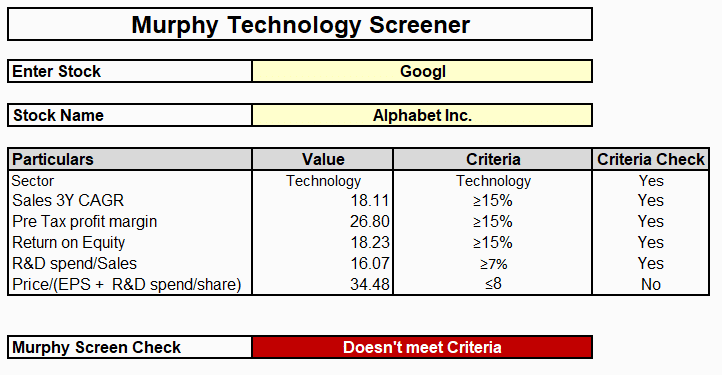
To apply the Murphy growth-flow screen, MarketXLS Template is used. All you need to do is add the stock’s ticker symbol, and the template will automatically check if the stock meets the criteria. The first filter screens for the company’s annual sales growth to be at least 15% over the last three years. The three years is a short enough time frame to reflect a relevant period, yet long enough to identify a significant trend.
In the next part, the pretax profit margin requirement of at least 15% indicates a firm’s profitability. It also suggests that the firm may have exclusivity and can sell its product at a significant profit.
The next screen looks for the Return on Equity. With high sales growth accompanied by high-profit margins, it is not surprising that the company has a return on equity of at least 15%.
Murphy feels that a technology company can succeed well if it commits more to Research and Development. Its ability to invest in R&D is critical for its growth. However, R&D affects the bottom line, and its current reported earnings may fall proportionately. Hence, a company that spends more on R&D will have a relatively higher price-earnings ratio. The company’s R&D as a percentage of sales should be at least 7%, suggesting that it is committed to its growth.
The Growth Flow Model
For a valuation approach appropriate for technology firms, Murphy adds per-share R&D spending (R&D spending divided by the number of shares outstanding) to earnings per share to determine a company’s growth flow. Dividing the current price of a stock by the growth flow per share provides the price-to-growth-flow ratio. Murphy uses this ratio to measure the underlying investment value of technology stock.
The price-to-growth-flow ratio is calculated as:
Per-share R&D + EPS = Growth flow
Price ÷ growth flow = Price-to-growth-flow ratio
The price-to-growth-flow ratio determines inexpensive stocks early and accurately. Murphy views technology stocks as reasonably priced when price-to-growth-flow ratios are around 10 to 14; anything under 8 is cheap and below 5 is an absolute bargain; 16 and over is too expensive. The MarketXLS template screens for stocks that have price-to-growth-flow ratios below 8.
All trademark referenced is the property of their respective owners. Other trademarks and trade names may be used in this document to refer to either the entity claiming the marks and names or their products. MarketXLS disclaims any proprietary interest in trademarks and trade names other than its own, or affiliation with the trademark owner.
Disclaimer
None of the content published on marketxls.com constitutes a recommendation that any particular security, portfolio of securities, transaction, or investment strategy is suitable for any specific person. The author is not offering any professional advice of any kind. The reader should consult a professional financial advisor to determine their suitability for any strategies discussed herein. The article is written for helping users collect the required information from various sources deemed to be an authority in their content. The trademarks if any are the property of their owners and no representations are made.
References:
https://aaii.medium.com/aaii-stock-ideas-murphy-technology-strategy-screen-3839e019160e

I invite you to book a demo with me or my team to save time, enhance your investment research, and streamline your workflows.