")
James Patrick O’Shaughnessy is a portfolio manager and principal at O’Shaughnessy Asset Management. He is considered to be an expert in the field of investor behaviour and investing strategies. The O’Shaughnessy Market Leaders Value Strategy seeks to provide long-term growth through investments in capitalised domestic equities. Large and prominent companies, usually market leaders and meet the O’Shaughnessy quality criteria, have high valuations and high shareholder yields, which combines a company’s annual dividend and its annual rate of stock buybacks. Stocks are selected and weighted based on conviction and are broadly constrained by sector and industry.
Finding the Right Stocks
O’Shaughnessy argues that investors can predict where the markets are going by simply looking at long-term historical trends. O’Shaughnessy developed four stock selection approaches for individual investors that attempt to take maximum advantage of market trends through an examination of stock market history. He focuses on finding stocks among the various market capitalisations that are most likely to do well based on his research.
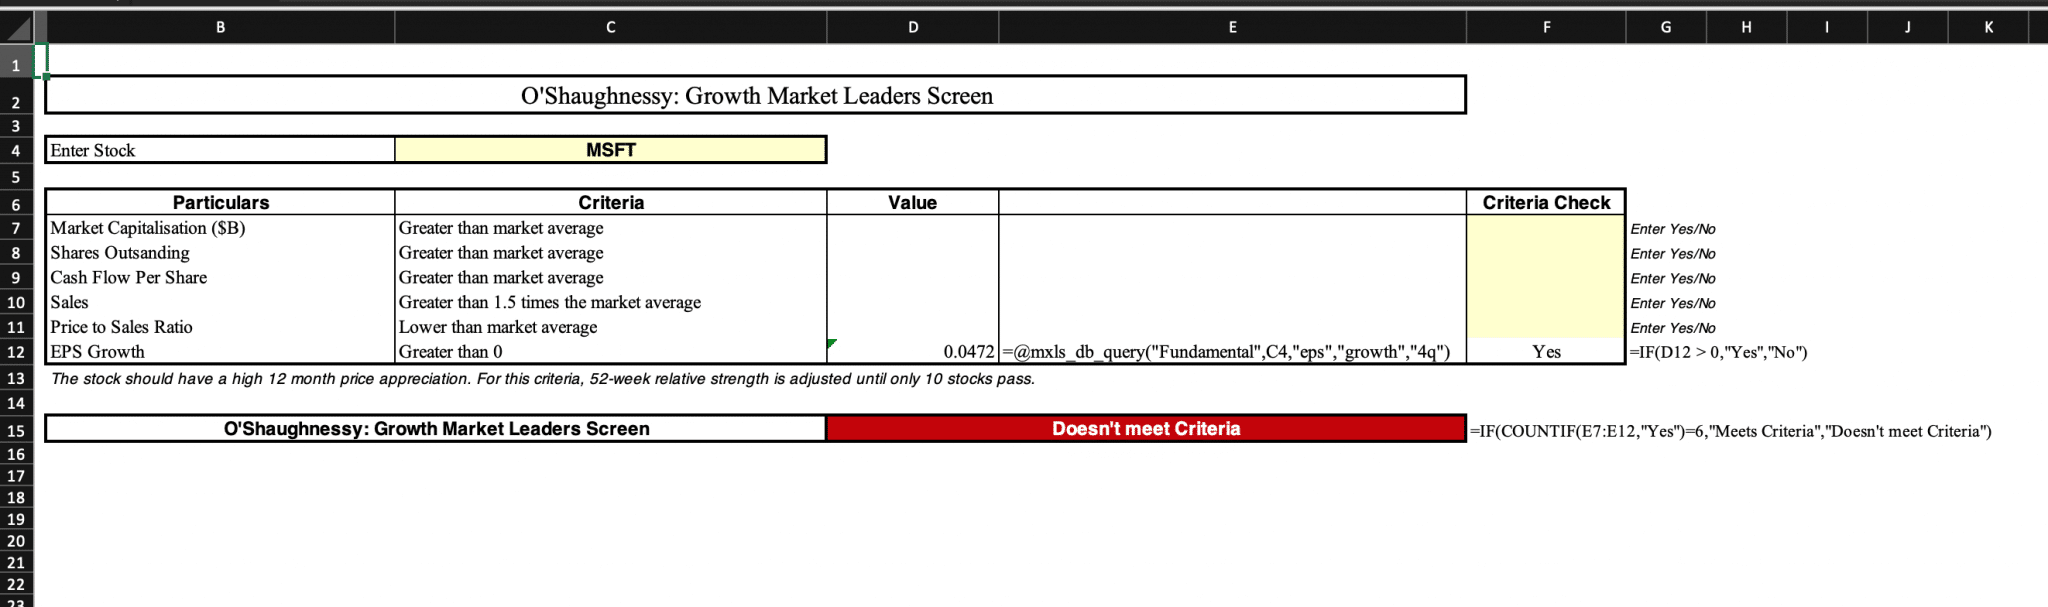
 Link to the Template: https://marketxls.com/template/oshaughnessy-growth-market-leaders-screen
O’Shaughnessy’s Criteria:
• Market capitalisation should be greater than the market average
• The number of shares outstanding should be greater than the market average
• The cash flow per share should be greater than the market average
• The sales should be greater than 1.5 times the market average
• The price to sales ratio for the stock should be lower than the market average
• The EPS growth over the last 12 months should be greater than zero
• The stock should have a high 12-month price appreciation. For the last criteria, the 52-week relative strength is adjusted until only ten stocks pass the test.
Using MarketXLS
In the template, enter the stock ticker. In this example, we have considered Microsoft Corp. (MSFT). The price to sales ratio is 0.0472, which means that it matches O’Shaughnessy’s criteria. However, the stock doesn’t fulfill the other criteria. Thus, the stock MSFT doesn’t pass O’Shaughnessy’s Growth Market Leader’s Screen.
Analysing the Screener
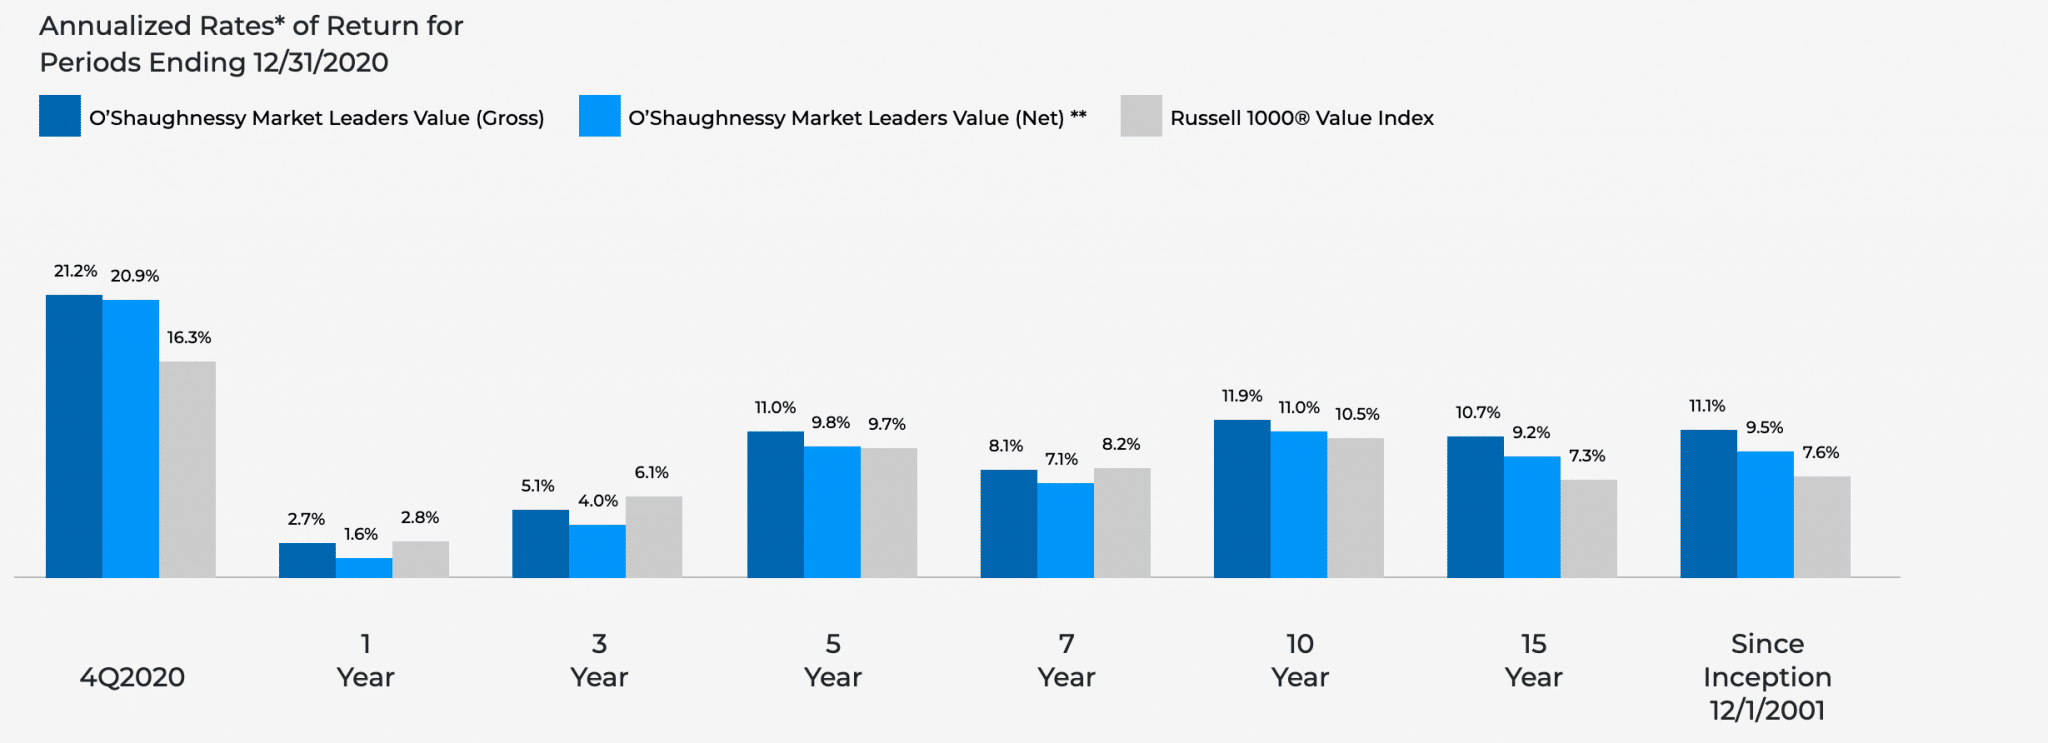
We now look at the performance of the O’Shaughnessy screen since its inception in 2001.
The fund has consistently performed well, churning out returns more than or at par with the Russell 1000 Value Index.
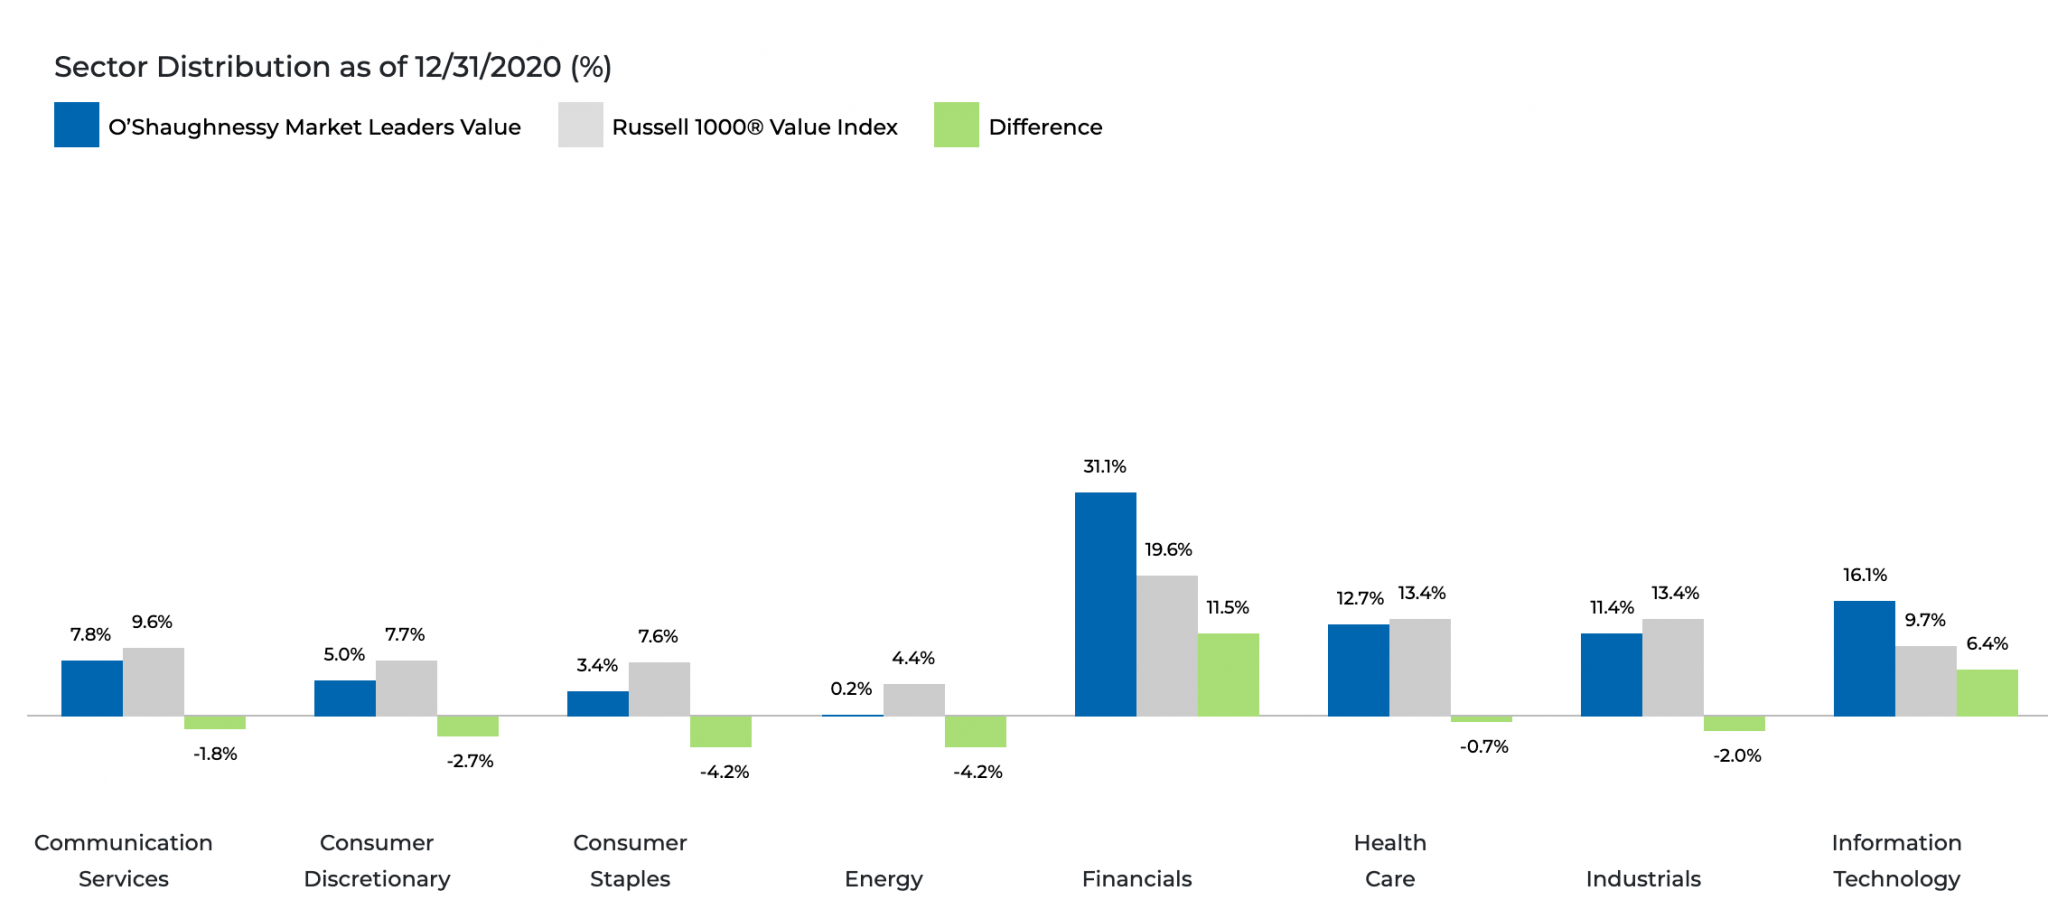
O’Shaughnessy’s Market Leaders Growth Screen emphasises diversification, but the sector allocations are not equal. We see that around 31.1% has been allocated to financial stocks and 16.1% to IT stocks. On the other hand, only 0.2% has been allocated to the energy sector. All this information is as of 31/12/2020 and is subject to change.
The Bottom Line
While building a portfolio, O’Shaughnessy advises that the stocks should have the following characteristics.
- • Pay dividends, buy back shares, and have other shareholder-friendly characteristics.
- • Provide investors with solid and consistent returns
- • It should be attractively priced
- • Show momentum or have favourable uptrends
O’Shaughnessy believes: “Investing success is incredibly simple: spend less than you earn, make consistent investments in the global market and wait. If you do these three things, you cannot help but get rich as compounding works for you over time. But simple doesn’t mean easy. That last step (wait) is incredibly hard to do in practice. Controlling your behaviourw matters more than anything.”
Disclaimer
None of the content published on marketxls.com constitutes a recommendation that any particular security, portfolio of securities, transaction, or investment strategy is suitable for any specific person.
The author is not offering any professional advice of any kind. The reader should consult a professional financial advisor to determine their suitability for any strategies discussed herein.
The article is written for helping users collect the required information from various sources deemed to be an authority in their content. The images, copyrights, and trademarks if any are the property of their owners, and no further representations are made.
