Financial Ratio Analysis In Excel (Download Excel Template)

Meet The Ultimate Excel Solution for Investors
- Live Streaming Prices Prices in your Excel
- All historical (intraday) data in your Excel
- Real time option greeks and analytics in your Excel
- Leading data in Excel service for Investment Managers, RIAs, Asset Managers, Financial Analysts, and Individual Investors.
- Easy to use with formulas and pre-made sheets

Ratio Analysis, also known as Financial Statement Analysis, involves evaluating the financial statements of companies, and comparing those results to similar companies; typically within the same sector or industry. Because ratios are most useful when compared to other ratios, and it is important to compare relevant ratios. Example; Ratio Analysis would not be useful in comparing a Health Care company and an Energy company, as these are two vastly different types of companies, in very different sectors. Rather, Ratio Analysis helps investors better understand the risks and rewards associated with a particular company prior to investing.
Common ratios that most investors have at least heard of are the current ratio, the debt-equity (D/E) ratio, return on equity (ROE), and the price/earnings (P/E) ratio. These ratios, while important, only make up a fraction of the larger picture that is Ratio Analysis. There are many financial ratios but they can be broken down into three subcategories, each providing their own puzzle piece of financial information.
Liquidity Ratios allow an investor to understand the ability of a company to pay off its current short-term debt. This involves understanding how liquid a company’s assets are. Common liquidity ratios are the current ratio and quick ratio. When reviewing current assets vs liabilities, these ratios provide insight on whether a company will be able to cover the debt, and if not; how quickly can the company raise the capital to do so.
Performance Ratios provide insight into the profitability and operating efficiency of the company. They assist the investor by shedding light onto profit margins, asset turnover, and return on equity; these are only a select few of the ratios used for a thorough analysis. For a company, being able to generate revenue while accounting for costs is important for growth. An investor would expect higher performance ratios compared to the company’s piers; additionally, better ratios period over period, also speak to how well a company is performing.
Risk Ratios are another set of values investors need to pay attention to. Leverage ratios, sometimes referred to as Debt to Equity Ratios, help identify the sensitivity between changes in operating income and revenue. Example, Fixed assets like a warehouse, can be used as collateral to finance debt. Thus the leverage ratio would help determine the sensitivity of that debt based on the income generated from the operations of the warehouse. Lowering, and reducing leverage is a positive sign of adequate cash flow.
Coverage ratios would be another group under our risk category. These refer to the ability of a company to cover interest payments, and or debt payments on their liabilities. Faulting on debt obligations is a sure sign that a company is struggling to generate enough operating income, and is a cause for investor worry.
Ratio Analysis is one of the many tools available to an investor when determining an investment opportunity. This summary reviewed only a handful of financial ratios available, but the point is still clear; this type of information will help greatly in identifying potential investments.
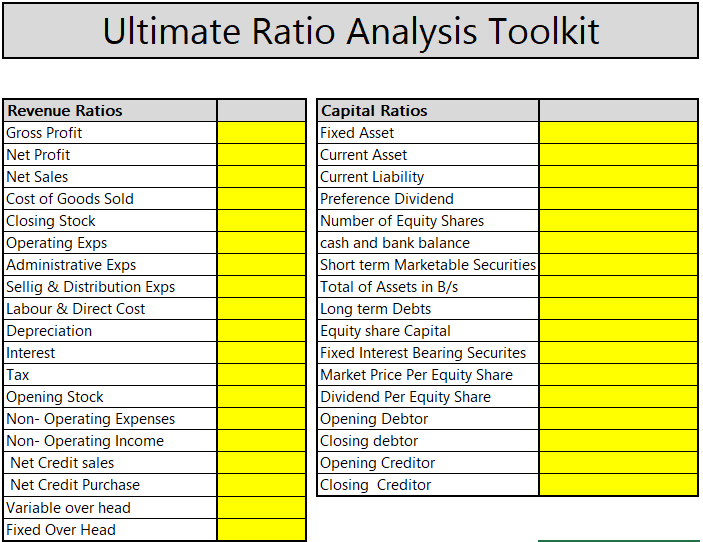
At MarketXLS we have prepared an ultimate ratio analysis toolkit for investors. All you have to do is populate a few numbers and the all ratios will be calculated for you. Not only this toolkit has automatic formulas to calculate the ratios but also the template explains what ratio tells you what, what ratio is good at what number and what are the thresholds.
You can purchase the Ultimate ratio analysis template at the link here. Hope you find this useful.
Buy The Ultimate Ratio Analysis Toolkit for just $19 $69
Special Offer: Get this discounted price of $19 (normally $69) Before it’s too Late!


- Learn all key ratios to use to analyze financials
- Easy to read, short and understandable descriptions
- Learn the thresholds/ranges of financial ratios
- Learn what values are considered as good indicators
- Excel template to calculate all ratios
- Either enter your data or use MarketXLS
- Be an economic analysis superhero
Instant Delivery
Secure Processing

I invite you to book a demo with me or my team to save time, enhance your investment research, and streamline your workflows.