


Stock price in Excel can be inserted three ways: Excel's built-in Stocks data type (free with Microsoft 365, delayed, refreshed manually), a Power Query web import (free, refreshed on a schedule), or a MarketXLS formula. With MarketXLS, =Last("AAPL") inserts an on-demand price and =QM_Stream_Last("AAPL") inserts a streaming price that updates on its own. Real-time streaming requires the MarketXLS Advanced or Business plan; on the Standard plan, US stock quotes are 15-minute delayed.
This article walks through each method, plus how to track many tickers, refresh automatically, and set price alerts.
Want this live in your own workbook? MarketXLS adds =Last, =QM_Stream_Last and 1,000+ other formulas to Excel. See plans and pricing.
For a broader product-level overview of formulas, plan fit, and workbook examples, see our guide to stock quotes in Excel.
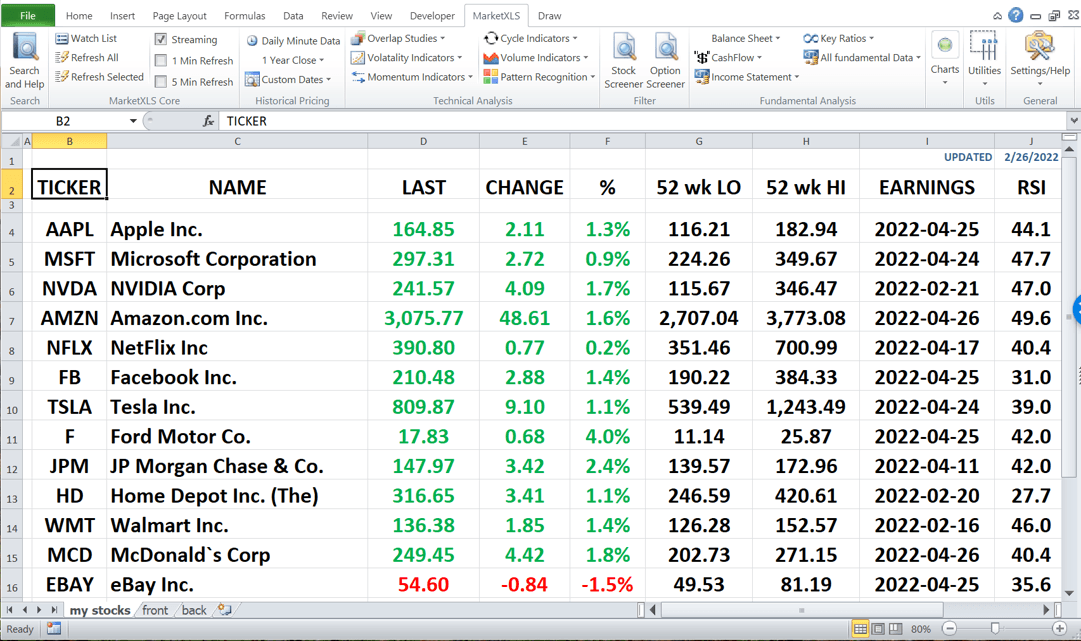
Excel Stock Tracking
How do I insert current stock price in Excel?
You can insert a current stock price with Excel's Stocks data type, a web data connection, or a MarketXLS function.
Using Excel's built-in Stock data type: Start by opening a new spreadsheet and entering stock symbols into cells (like AAPL, MSFT, GOOGL). Navigate to the "Data" tab and select "Stocks" from the data types gallery. Excel will convert these symbols into linked data types that automatically pull current stock information. This method is convenient for basic tracking of specific stocks over time.
Using web data connections: Navigate to the "Data" tab and click on "Get Data." Choose "From Web," then enter the URL of a finance site with real-time stock prices. Click "OK" and wait for the data to load. Select the appropriate table containing the stock prices and click "Load." The data will populate your Excel sheet.
Using MarketXLS formulas: Install the MarketXLS add-in and type =Last("AAPL") in a cell for the last price, or =QM_Stream_Last("AAPL") for a price that streams. Quotes come from QuoteMedia. Real-time streaming for US stocks requires the Advanced or Business plan.
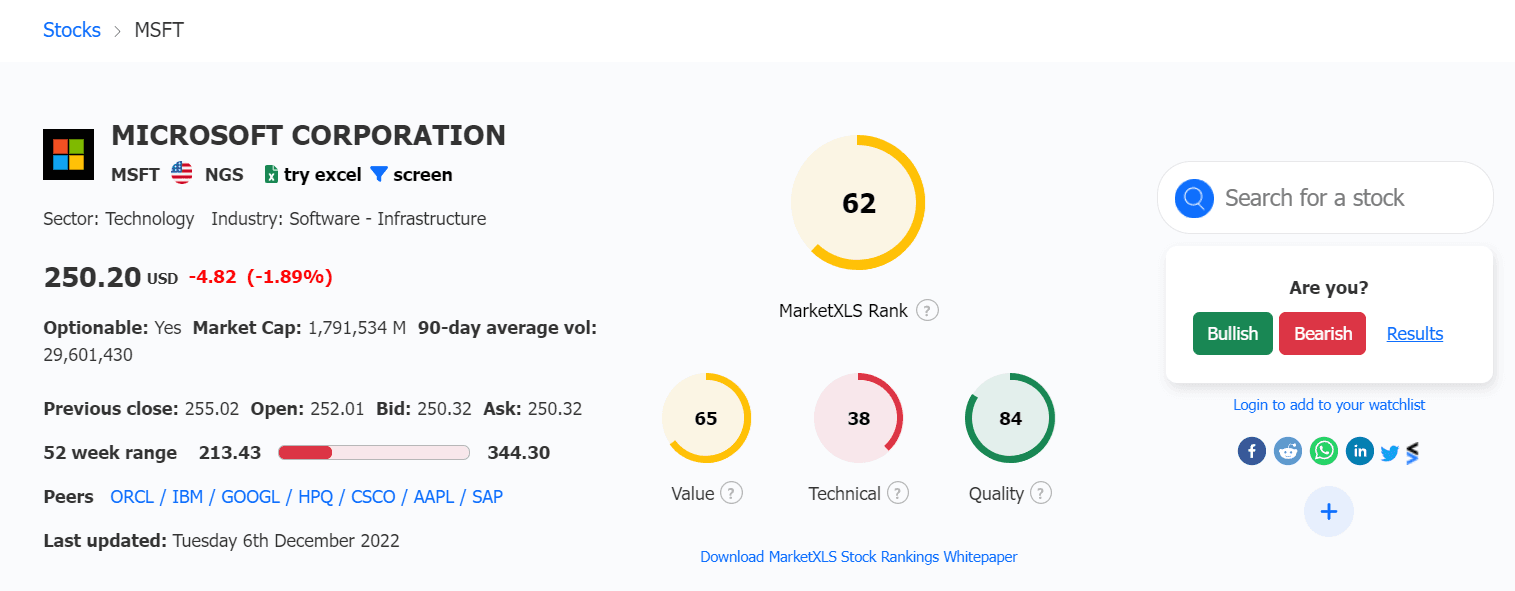
MarketXLS Stock Landing Page
How can I track multiple stock prices in a single Excel workbook?
To track multiple stock prices in a single Excel workbook, start by listing the stock symbols in one column. You can use Excel's built-in "Stock" data type feature for basic tracking by selecting the stock symbols, going to the "Data" tab, and clicking "Stocks." Excel will convert these symbols into live stock data.
Create additional columns for attributes like current price, change, and volume. Use the "Refresh All" option in the "Data" tab to update the data regularly.
For historical data, use Excel's "Get & Transform" tool to import data from financial websites. Set up conditional formatting to highlight certain price changes, making it easier to spot significant movements at a glance.
You can create informative charts with the data for visual analysis. Save the workbook to maintain all your tracked information in one place.
If you need prices that update without refreshing, MarketXLS QM_Stream_* functions update automatically while streaming is on (real-time on the Advanced and Business plans).
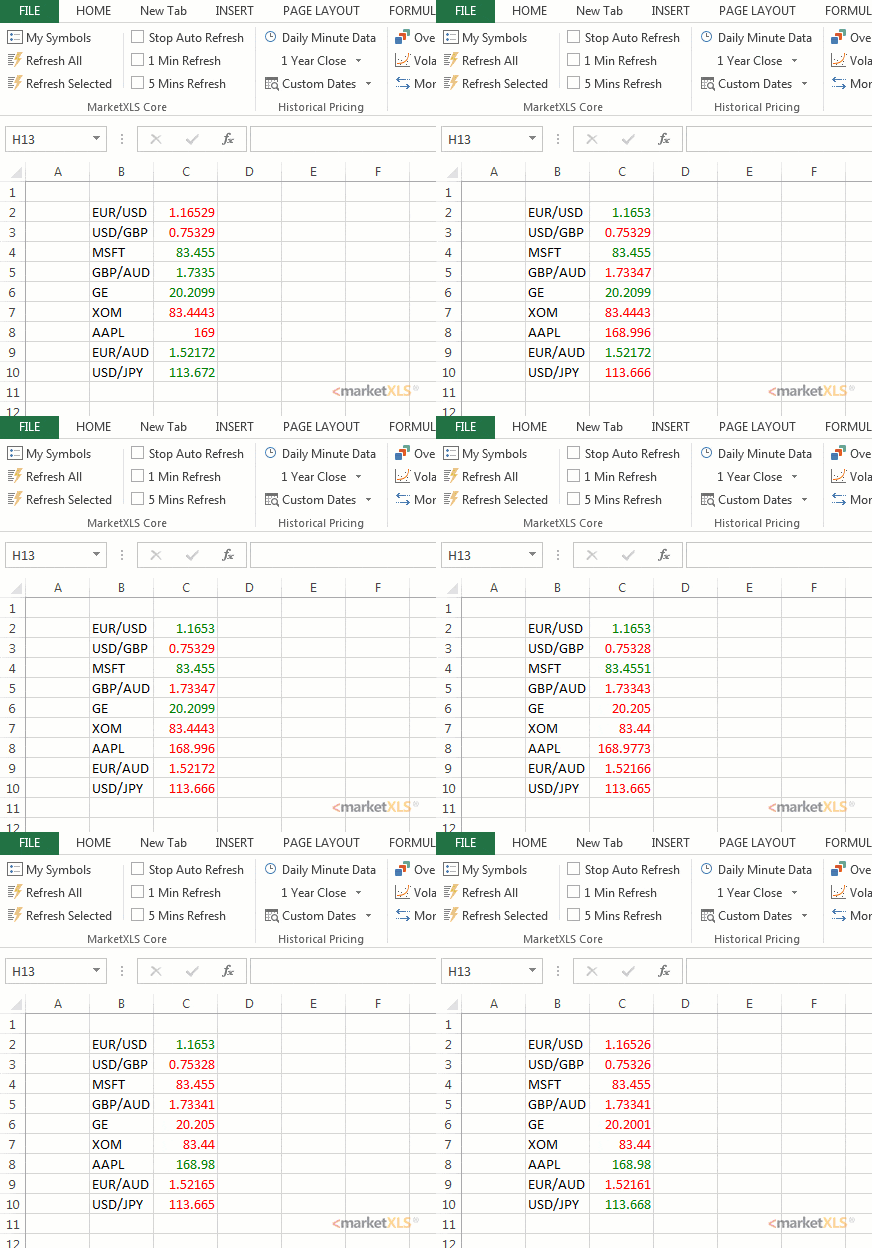
Stock Streaming
How do I refresh stock prices in Excel automatically?
To refresh stock prices in Excel automatically using the built-in features, you can use Excel's "Stock" data type. Select the cells where you want the stock data to appear, input the stock tickers, and convert these cells to the "Stock" data type. Excel will pull in the latest stock prices and related information.
To ensure the data is updated regularly, set your workbook to refresh at a desired interval. Go to "Data" > "Queries & Connections" and set the background refresh properties. This allows Excel to connect to online sources and update without manual intervention. Remember, you need an active internet connection for automatic updates.
MarketXLS streaming functions (QM_Stream_*) refresh on their own while streaming is on, so there is no refresh interval to set.
How can I set up stock price alerts in Excel?
You can set up stock price alerts in Excel using a combination of formulas and conditional formatting. First, import stock data into your Excel sheet using the "Data" tab and "Get Data" from the web feature, or use MarketXLS streaming functions for real-time data.
Next, identify the specific cell where the stock price is located. Create a new cell for your alert threshold and enter the desired price. Use a formula, such as =IF(Cell_with_stock_price>=Alert_threshold, TRUE, FALSE) to check if the condition is met.
Then, apply conditional formatting to the stock price cell. Use the "Conditional Formatting" tool to highlight the cell if the formula results in TRUE. This will change the cell's background or font color when the stock price hits your alert level.
For more dynamic alerts, you can also link Excel to an external source using VBA or Power Query to update data in real-time. This setup ensures you are instantly aware when prices reach your specified thresholds.
How do I link live stock prices from an external data source to Excel?
To link live stock prices from an external data source to Excel, you first need a reliable data provider. Services like Alpha Vantage, Yahoo Finance, or Bloomberg offer API access for basic data.
Go to the Data tab in Excel and select "Get Data" or "From Web". Enter the URL provided by your data source. You might need API keys for authentication, which you can add in the query settings. Once connected, you can format and refresh the queries to fetch real-time data. Use Excel's "Data" tab to set the refresh rate. Ensure your internet is stable to continually update stock prices.
MarketXLS avoids the API setup: its functions return QuoteMedia quotes directly into cells, and streaming functions update without manual refreshing.
How do I import stock prices from websites like Yahoo Finance into Excel?
You can import prices from a web page with Power Query. First, open Excel and select the "Data" tab. Click on "Get Data" and choose "From Web" in the drop-down menu. Enter the URL of the Yahoo Finance page that features the stock prices you need.
Once the web page loads in the Navigator window, select the table or data you want to import. Click "Load" to bring the data into your Excel worksheet. The information will now appear in your spreadsheet, and you can refresh it whenever needed. Web imports break when the site changes its page layout, and a site's terms may restrict automated use. Additionally, you can create charts and analyses based on the imported data.
How to insert stock price in excel with MarketXLS?
Inserting a stock price with MarketXLS takes one formula once the add-in is installed. The steps below focus on the streaming functions.
1. Install and Set Up MarketXLS
Install the MarketXLS add-in (Windows desktop add-in, or the Microsoft 365 add-in for Excel on Mac and the web, where functions use the mxls. prefix). For real-time streaming functions, you need the Advanced or Business plan.
2. Using MarketXLS Streaming Functions
MarketXLS streaming functions use the QM_Stream_ prefix and return QuoteMedia data that updates automatically while streaming is on. Each unique symbol or option contract uses one live symbol subscription.
3. Examples of Real-Time Streaming Functions
Current Last Price: To get the real-time last traded price of a stock:
=QM_Stream_Last("MSFT")
This function streams the current last traded price for Microsoft stock, updating continuously during market hours.
Bid and Ask Prices: To get real-time bid and ask prices:
=QM_Stream_Bid("AAPL")
=QM_Stream_Ask("AAPL")
These functions show the current bid and ask prices for Apple stock.
High and Low Prices: To track the day's high and low:
=QM_Stream_High("GOOGL")
=QM_Stream_Low("GOOGL")
These return the highest and lowest prices reached during the current trading day.
Opening and Closing Prices: To get opening and closing prices:
=QM_Stream_Open("TSLA")
=QM_Stream_Close("TSLA")
The Open function shows the price at which the stock first traded when the market opened at 9:30 AM EST, while Close shows the closing price.
Volume Data: To track trading volume:
=QM_Stream_Volume("MSFT")
This streams the real-time volume of shares traded in the current session.
Price Changes: To monitor price changes and percentage changes:
=QM_Stream_Change("AAPL")
=QM_Stream_PercentageChange("AAPL")
These functions show the dollar change and percentage change from the previous close.
Pre-Market and Post-Market Data: To track extended hours trading:
=QM_Stream_PreMarketLast("MSFT")
=QM_Stream_PreMarketVolume("MSFT")
=QM_Stream_PostMarketLast("MSFT")
=QM_Stream_PostMarketVolume("MSFT")
These functions stream data from pre-market and post-market trading sessions.
Options Greeks: For options traders, MarketXLS streams options Greeks (real-time on the Advanced and Business plans; options are end-of-day on Standard). Replace the example contract below, which has expired, with a current option symbol:
=QM_Stream_Delta("@MSFT 220114C00300000")
=QM_Stream_Gamma("@MSFT 220114C00300000")
=QM_Stream_Theta("@MSFT 220114C00300000")
=QM_Stream_Vega("@MSFT 220114C00300000")
=QM_Stream_ImpliedVolatality("@MSFT 220114C00300000")
These functions return delta, gamma, theta, vega, and implied volatility for the contract.
Advanced Metrics: Access additional market metrics:
=QM_Stream_Vwap("AAPL")
=QM_Stream_Twap("AAPL")
VWAP (Volume-Weighted Average Price) and TWAP (Time-Weighted Average Price) are common execution benchmarks.
4. Insert the Function
In your Excel sheet, click on the cell where you want the stock price to appear. Type the relevant MarketXLS streaming function and press Enter. The cell will immediately begin streaming live data.
5. Automatic Updates
MarketXLS streaming functions automatically update as new market data becomes available. There's no need to manually refresh. The data updates continuously during market hours, providing real-time tracking of price movements.
6. Additional Data
Besides prices, you can retrieve other real-time data such as:
- Bid and Ask sizes:
=QM_Stream_BidSize("AAPL"),=QM_Stream_AskSize("AAPL") - Last trade size and time:
=QM_Stream_LastTradeSize("MSFT"),=QM_Stream_LastTradeTime("MSFT") - Trade counts:
=QM_Stream_TradeCount("GOOGL") - Accumulated volume and price data:
=QM_Stream_AccumulatedVolume("TSLA")
Get started quickly with templates: MarketXLS publishes ready-made templates. Check out the Equity Research Dashboard Template for a comprehensive setup.
Snapshot vs streaming: which quote function to insert
Use snapshot functions for most tickers and streaming functions only for the ones you watch closely. Too many streaming cells is a common cause of a slow workbook.
Snapshot functions fetch the price when the sheet recalculates or when you click Refresh:
=Last("AAPL")        On-demand last price
=QM_Last("AAPL")     On-demand last price, QuoteMedia feed
Formula documentation: Last, QM_Last
Streaming functions hold a live connection and update on their own while streaming is on:
=QM_Stream_Last("AAPL") Continuously updating last price, QuoteMedia feed
Formula documentation: QM_Stream_Last
| Aspect | Snapshot (=Last()) | Streaming (=QM_Stream_Last()) |
|---|---|---|
| Update method | When Excel recalculates or you refresh | Automatic while streaming is on |
| Symbol usage | No live subscription used | One live symbol subscription per unique symbol |
| CPU usage | Low | Higher (depends on symbol count) |
| Plan | Any plan (Standard is 15-min delayed) | Real-time on Advanced and Business |
| Best for | Analysis, reporting | Active monitoring, trading |
A practical rule: stream the positions you actively watch and use snapshot functions for everything else. The options pricing page states that options tracking is limited to 300 symbols, so move a broad universe to =Last() and reserve streaming for the active watchlist.
The MarketXLS ribbon has a streaming checkbox. Uncheck it to freeze every streaming cell at its current value, which is useful when you want to capture the tape at a specific moment rather than watch it move.
How the methods for inserting a stock price compare
| Feature | Microsoft STOCK Data Type | Power Query / Web Query | MarketXLS Snapshot | MarketXLS Streaming |
|---|---|---|---|---|
| Real-time updates | Delayed | Manual or scheduled refresh | On-demand refresh (15-min delayed on Standard) | Automatic streaming (real-time on Advanced and Business) |
| Update frequency | Manual refresh | Scheduled refresh | When Excel recalculates | Continuous while streaming is on |
| Data depth | Basic price + market cap | Depends on source | 1000+ functions (prices, fundamentals, options) | Price, bid, ask, volume, Greeks |
| Historical data | No | Depends on source | Yes (=QM_GetHistory()) | No (live only) |
| Options data | No | Limited | Options chains (=QM_GetOptionChain()) | Streaming per contract |
| Ease of setup | Very easy | Moderate | Easy (add-in) | Easy (add-in) |
| Cost | Free (Office 365) | Free | MarketXLS subscription | MarketXLS subscription |
| Max tickers | No hard limit | Depends on source | Limited by refresh time | One live subscription per symbol; options tracking limited to 300 symbols |
Adding context columns next to the price
Put valuation, income, and trend columns next to the price. These MarketXLS functions sit alongside the quote:
=PERatio("AAPL")                        Valuation
=MarketCapitalization("AAPL")           Company size
=DividendYield("AAPL")                  Income yield
=RSI("AAPL")                            Momentum, 14-day
=SimpleMovingAverage("AAPL", 50)        50-day trend
=QM_GetHistory("AAPL")                  Historical OHLCV, QuoteMedia feed
Formula documentation: PERatio, MarketCapitalization, DividendYield, RSI, SimpleMovingAverage, QM_GetHistory
For the day change, =PreviousClose("AAPL") returns the prior session's close, which you can compare to the live price in a helper column.
If streaming functions stop updating
- Confirm the streaming checkbox in the MarketXLS ribbon is checked.
- Confirm the market is open. Streaming functions hold their last value outside market hours.
- Confirm you have not exceeded your live symbol subscriptions (each unique symbol or option contract uses one).
- If cells show
#VALUE!or#N/A, verify the ticker spelling and that your plan covers the requested feed. - If the workbook is slow, convert the least-watched streaming cells to
=Last().
What MarketXLS adds for real-time market tracking
MarketXLS adds streaming quotes, options data, extended-hours data, history, and portfolio tools to Excel:
Live Data Streaming
MarketXLS streams stock data directly into Excel. The Advanced and Business plans provide real-time streaming functions like QM_Stream_Last, QM_Stream_Volume, QM_Stream_High, and many others, covering live stock quotes, bid/ask prices, trade volumes, and more.
Real-Time Stock and Options Prices
MarketXLS also streams options prices (real-time on Advanced and Business, end-of-day on Standard). This includes metrics like option delta, gamma, theta, vega, rho, and implied volatility, allowing comprehensive options analysis.
Pre-Market and Post-Market Trading
Track extended hours trading with dedicated functions for pre-market and post-market sessions. Monitor price movements, volume, and percentage changes before the market opens and after it closes.
Options Filtering and Scanning
MarketXLS includes functions for filtering and scanning options by criteria such as volume and open interest.
Historical Data
Users have access to historical stock and options data, enabling backtesting and analysis of past market performance to make informed decisions.
Portfolio Management
MarketXLS lets you track portfolios in Excel and calculate performance and ratios. See the MarketXLS Portfolio Manager.
Crypto Data Integration
MarketXLS also returns cryptocurrency prices in Excel. See crypto data in Excel.
Enhanced Analysis Functions
MarketXLS also has functions for put/call ratios, total options volume, open interest, and technical indicators such as =RSI and =SimpleMovingAverage.
Summary
Each method for inserting a stock price in Excel fits a different need:
Insert Stock Price in Excel: Open a new sheet, go to "Data", select "Get Data", and choose "From Web". Enter a finance site URL and load the real-time stock prices. Alternatively, use the built-in "Stocks" data type for basic updates.
Track Multiple Stock Prices: List stock symbols and convert them using "Stock" data type under the "Data" tab. Refresh data regularly and use conditional formatting for easy monitoring.
Automatic Price Refresh: Use stock tickers and convert to "Stock" data type. Set refresh intervals in "Queries & Connections" for automatic updates.
Set Price Alerts: Import stock data and use formulas and conditional formatting to create alerts for specific price points.
Link Live Prices from External Sources: Use APIs from providers like Alpha Vantage. Go to "Data", select "Get Data", and authenticate with API keys for continuous updates.
Import Yahoo Finance Data: Visit "Data" and choose "From Web". Enter the Yahoo Finance URL, select the desired table, and load it into Excel.
MarketXLS: Use =Last("AAPL") for an on-demand price on any plan (15-minute delayed on Standard). For real-time streaming, use =QM_Stream_Last("AAPL"), =QM_Stream_Volume("MSFT"), and other QM_Stream_* functions on the Advanced or Business plan, including options Greeks and pre-market/post-market data.
MarketXLS Benefits:
- Streams live stock and options data continuously
- Provides pre-market and post-market trading data
- Supports portfolio management and crypto data integration
- Offers enhanced analysis functions for comprehensive market tracking
- Includes ready-to-use templates
- No manual refreshing required with streaming functions on the Advanced and Business plans
See pricing for plan details.