Introduction
The Short Put Ladder is a limited risk, unlimited profit strategy in options trading that is employed when the trader thinks that the underlying security will experience significant volatility in the near term. A Short Put Ladder should be executed when one is expecting big movement in the underlying security price, favorably downside.
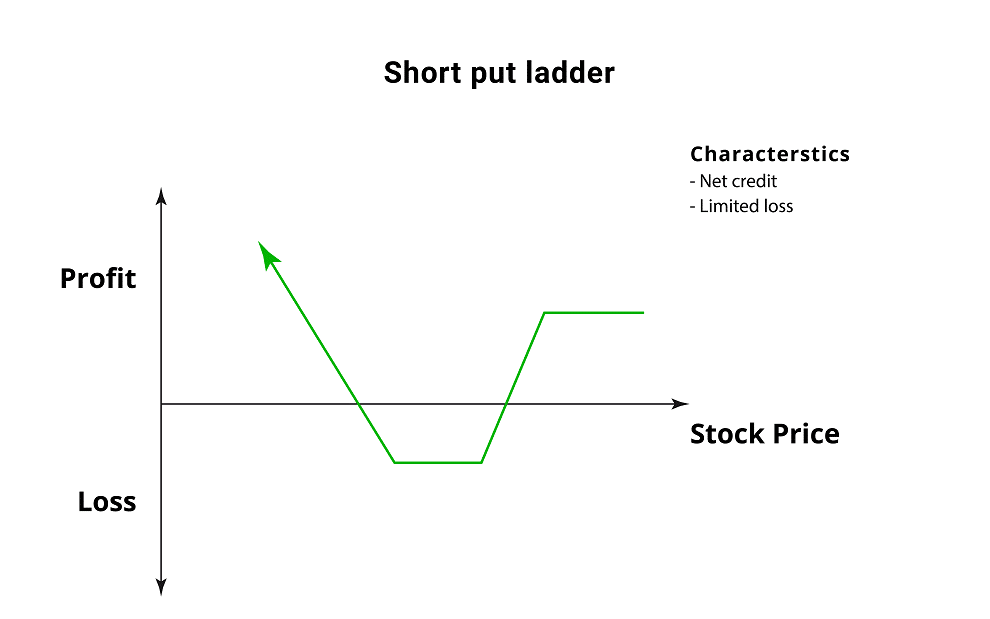
The Short Put Ladder is named as such because its payoff diagram looks like a ladder and it is initiated with Puts. In short, the Short Put Ladder is an options trading strategy that uses Put options to implement a trade that will capitalise on the increased volatility of the price of the underlying asset. It is a strategy with limited loss potential and unlimited profit potential.
Short Put Ladder Construction
To implement and execute this strategy, the trader will trade in three different contracts. The strike prices can be customized as per the suitability of the trader.
The three trading contracts will be:
- Selling 1 ITM (in the money) Put option
- Buying 1 ATM (at the money) Put option
- Buying 1 OTM ( out the money) Put option
To set up the Short Put Ladder, the options trader sells an in-the-money Put, buys an at-the-money Put and buys another lower strike out-of-the-money Put of the same underlying asset and expiration date. A trader can also initiate the Short Put Ladder strategy in the following way – Selling 1 ATM Put, Buying 1 OTM Put and Buying another 1 Far OTM Put.
Profit Potential
The maximum profit is limited to the initial credit received if the stock price rises above the upper breakeven point but large unlimited profit can be realised if the stock price makes a dramatic move to the downside below the lower breakeven point.
The further the price of the underlying security goes below the lower breakeven point, the greater is the realisable profit. Hence, there is unlimited profit potential as the price decreases. As the price of the underlying asset increases above the upper breakeven point, so does the realisable profit. However, at some price point above the breakeven point, the profit stays constant. This constant profit is shown as a horizontal line on the payoff diagram. This maximum profit is also the net credit received.
Maximum profit can be calculated with the formula:
Profit realised When Price of Underlying < Total Strike Prices of Long Puts – Strike Price of Short Put + Net Premium Received
Profit = Lower Breakeven – Price of Underlying
Maximum Profit = Unlimited
Limited Loss
Maximum loss for the Short Put Ladder strategy is limited and occurs when the underlying stock price on expiration date is trading between the strike prices of the Put options bought. At this price, while both the short Put and the higher strike long Put expire in the money, the short Put is worth more than the long Put, resulting in a loss. The loss can be calculated using the formula below.
Maximum loss can be calculated with the formula:
Max Loss = Strike Price of Short Put option – Strike Price of Higher Strike Long Put option – Net Credit Received + Commissions Paid
Max Loss Occurs When Price of underlying security is trading in between the Strike Prices of the 2 Long Puts
Breakeven Points
The Short Put Ladder position has 2 Breakeven points:
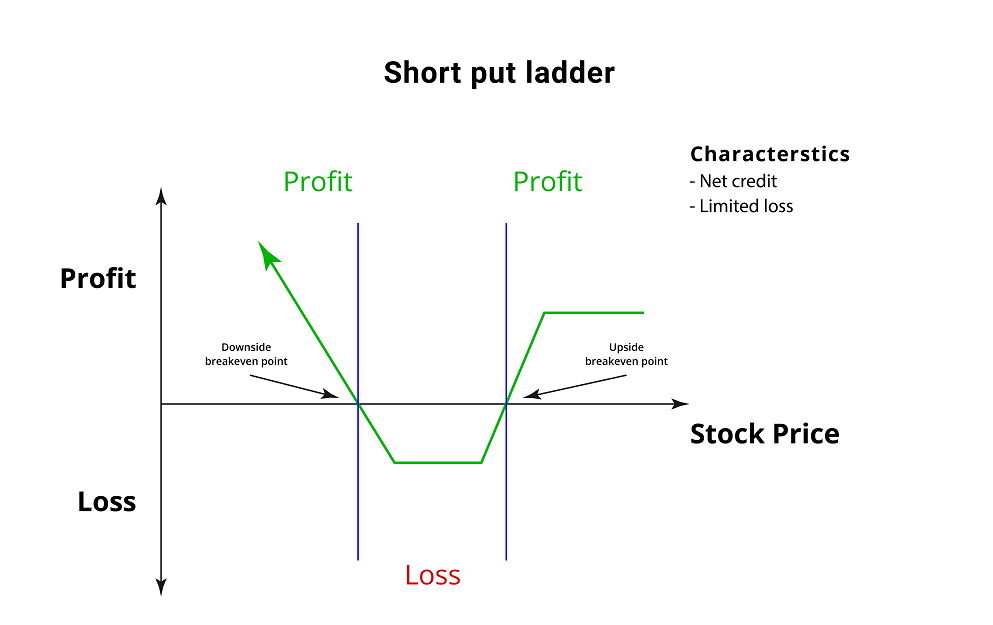
- Lower Breakeven Point = Total Strike Prices of Long Puts – Strike Price of Short Put + Net Premium Received
- Upper Breakeven Point = Strike Price of Short Put – Net Premium Received
Applying Short Put Ladder Strategy Using MarketXLS Template With an Example:
MarketXLS software is a one-stop solution for the analysis of your entire investments. It provides a host of functions like eps, various ratios, key fundamentals, historical data, options pricing and much more to assess the value of your investments. It provides a variety of templates for various options trading strategies and also to compare your portfolio stocks for doing a better analysis of your investments.
Step 1: Enter the stock ticker in cell C6 and press enter. The template will provide the upcoming expiry dates for the stock, current market price, and lot size. Select any one of the expiry dates and change the lot size according to your preference.
Link to the Template: https://marketxls.com/template/short-put-ladder/
Step 2: Enter the ATM strike price in cell C10.
Step 3: Enter the Spread (Difference between higher and lower strike price) in cell C11.
Step 4: The template might ask you to refresh. Go to the MarketXLS tab in the ribbon > Refresh All. Click on Refresh All.
The template uses the bid price for sells and ask price for buys and related premiums to calculate the net cash flow for you.

Step 5: The template also provides the Net Payoff Profile of the strategy. You need to enter the expected minimum and maximum expiry prices for the period. It will calculate the net profit or net loss for all the levels of expiry prices and present it graphically.
Microsoft Corporation (MSFT) as an example in the above template:
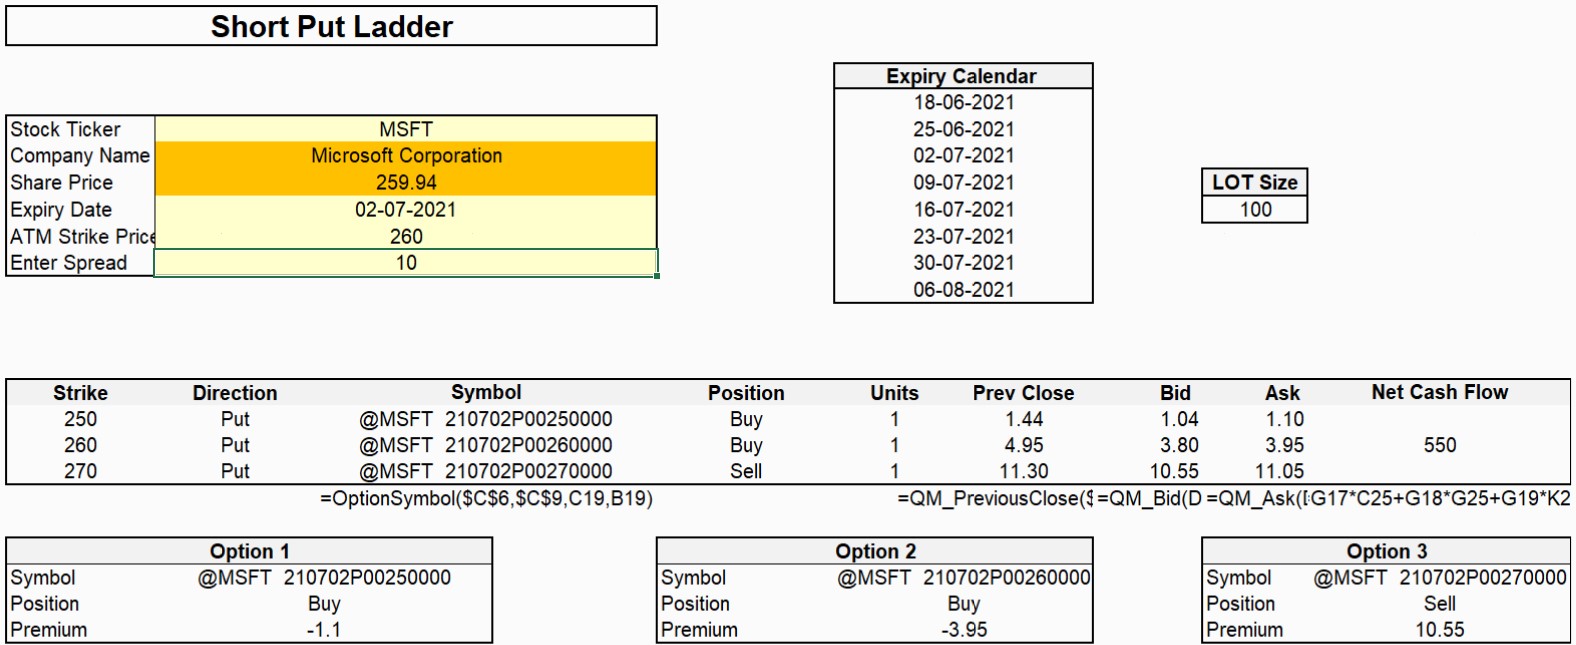
MSFT stock is trading at levels of $260 on 16th June 2021. I have selected the upcoming expiry of July 2, 2021 to enter the trade. I want to execute a Short Put Ladder strategy by buying an ATM Put @$260 and maintaining a spread of $10. Thus I would be buying another OTM Put @$250 and selling an ITM Put @$270.
The template will calculate the premium amounts for all the options and thus calculate the net cash flow for entering the trade, which is $550 credit in this case.
[ -1.1*100 ($250 strike) – 3.95*100 ($260 strike) + 10.55*100 ($270 strike) = +$550 ]
Suppose if the stock keeps trading at $260 on expiration date, only the Short Put will expire in money with an intrinsic value of $1000. Taking into account the initial credit of $550, buying back this put to close the position will leave me with a $450 loss, which is also my maximum possible loss.
If the stock trades at $270 on expiration, all the Puts will expire worthless and my profit will be the initial $550 received while entering the trade.
However, if the stock price drops to $236, all the Put options will expire in money. The Long Put option ($260) will expire with $2400 intrinsic value while the Long Put option ($250) will expire with $1400 value. Buying back the Short Put at this level will cost me $3400. That will still leave me with a profit of $400. Adding the initial credit received, my total profit will be $950. This profit will even be greater if the stock price dives below $236. The net profit can easily be determined by looking at the net payoff table within the template.
Here is a video explaining the Short Put Ladder Strategy using MarketXLS:
Bottom Line
A Short Put Ladder position is best to execute when you are confident about an underlying security moving significantly lower. Another scenario wherein this strategy can give profit is when there is a surge in implied volatility. It is an unlimited reward and a limited risk strategy only if movement comes on the lower side or else reward would also be limited.
Disclaimer
All trademarks referenced are the property of their respective owners. Other trademarks and trade names may be used in this document to refer to either the entity claiming the marks and names or their products. MarketXLS disclaims any proprietary interest in trademarks and trade names other than its own, or affiliation with the trademark owners.
Reference
https://www.theoptionsguide.com/short-put-ladder.aspx
https://www.5paisa.com/blog/short-put-ladder-strategy-explained
