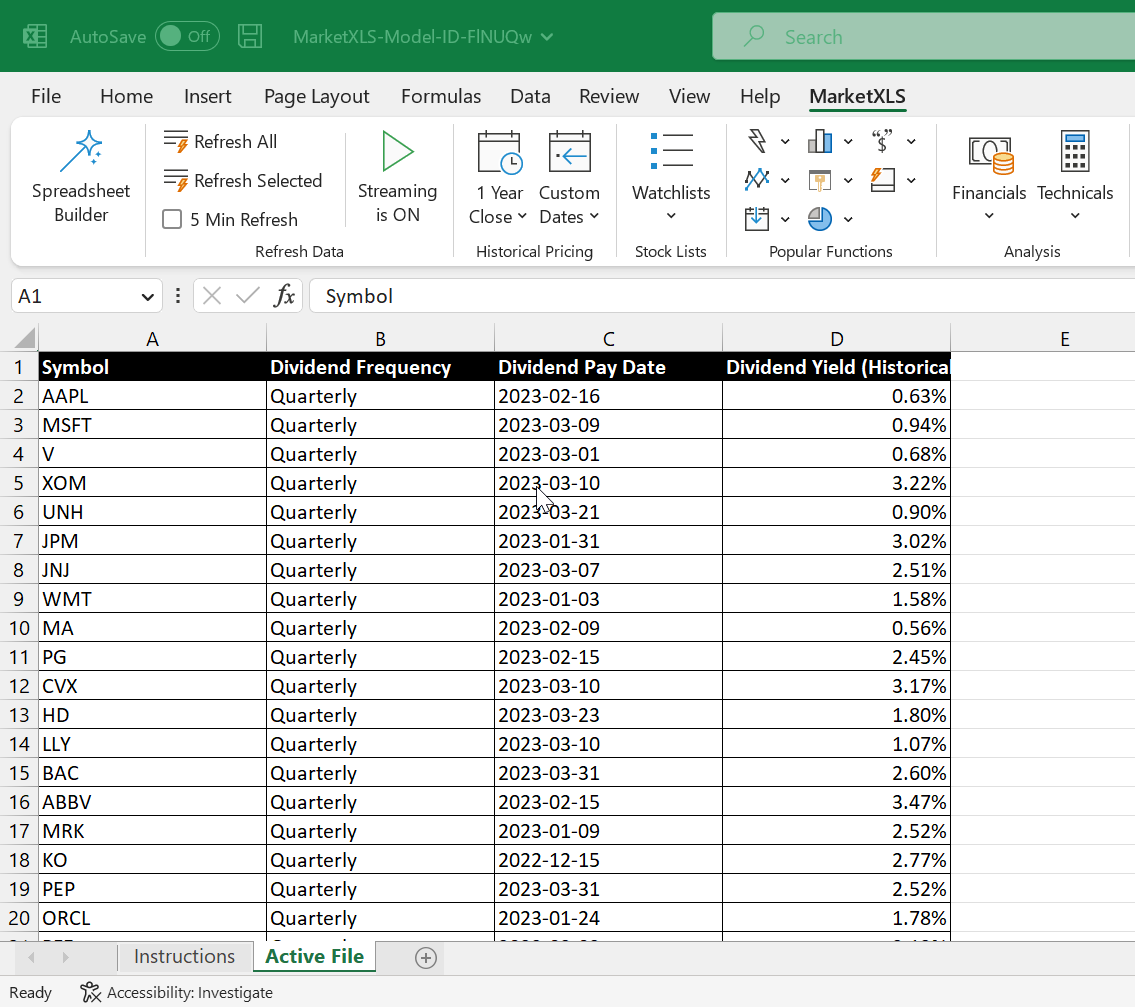
Using Spreadsheet Templates to Track Dividends
Dividends are payments made to stockholders by a company often as a reward for buying their stocks. It’s important to keep track of them either as a routine financial task or to assess the performance of a stock or other form of dividend investment. Spreadsheet templates are a great way to quickly and easily assemble data and formulas to create a comprehensive dividend tracking system.
Creating the Perfect Dividend Tracking Spreadsheet Template
Before you can get started with your spreadsheet, you will need to make sure you have the right template. You’ll want a template that has all the necessary formulas and cells needed to track your dividend investments. You may want to include a stock analysis template that includes the stock symbol, share price, dividend yield, capital gains, and dividend income for each stock. Additionally, you’ll want to add stock functions like calculate dividend payments, frequency of dividends, dividend yields, and dividend payout ratio. Make sure to also include a dividend investing cash flow calculator, stock dividend growth calculator, and dividend calculation functions that can help you never miss a dividend payment.
Tracking Your Portfolio with a Dividend Tracker Spreadsheet
Once you have your perfect template in place, you can begin tracking your dividend stock investments. You may want your template to incorporate a dividend tracker spreadsheet that can be used to track dividend stocks and ETFs. This can include recording dividend payments, stock prices, yields, and dividend income for each stock. You might also want to create a dividend income tracker that tracks total dividend income payments, amount of cash flow from dividends, and total returns from dividend investing.
Using Stock Analysis Templates for Your Dividend Spreadsheet
Another great feature of spreadsheet templates is the ability to import stock analysis data and dividend spreadsheet templates. With an analysis template you can easily calculate and analyze dividend data, calculate dividend yield, review dividend payment growth of stocks, and compare dividend payments and prices of different stocks. This can give you an easy way to compare stocks in your portfolio to the stock’s performance in the wider market. It can also help you calculate the dividend payout ratio as well as gain helpful insights into the stock like its analyst ratings and market value.
Where to Download a Dividend Spreadsheet Template
There are many high-quality dividend spreadsheet templates available to download online. You can choose a basic template that includes all the necessary formulas and cells for tracking your dividend portfolio or you can select a template that includes additional features like a stock analysis template and dividend tracking tools. You can also add on dividend investing add-ons to get the most out of your dividend spreadsheet. Be sure to choose a template that suits your needs and download it today.

