Value-at-risk using Excel is one of the most important financial tools that help an investor measure the risk of an investment portfolio. This article will discuss what it is, how it is then calculated, how MarketXLS calculates the Value-at-risk of your Portfolio.
Value-at-risk is a statistical measure of the riskiness of portfolios of assets. It quantifies the level of financial risk within a portfolio over a specific time frame. Value-At-Risk is a number, measured in price units or as a percentage of portfolio value, which defines a large percentage of cases (usually 95% or 99%) for the portfolio which is likely to not lose more than that amount of money.
To estimate the probability of the loss, we need to define the probability distributions of individual risks with a confidence interval. There are three vital elements of VaR:
1. A specified level of loss in value,
2. A fixed period over which risk is assessed
3. A confidence interval (given market condition).
**Value-at-risk (VaR) Methods and Calculations **
Historical VaRHistorical value at risk (VaR), also known as historical simulation or the historical method, refers to a particular way of calculating VaR. In this approach, we calculate VaR directly from past returns.
For example, suppose we want to calculate the 1-day 95% VaR for equity using 100 days of data. The 95th percentile corresponds to the least bad of the worst 5% of returns. In this case, because we are using 100 days of data, the VaR simply corresponds to the 5th worst day.

VaR
where:
VaR (1 – a) is the estimated VaR at the confidence level of 100 × (1 – a)%.
(Ra) is the mean of the series of simulated returns or P&Ls of the portfolio.
Ra is the worst return of a series of simulated P&Ls of the portfolio or, in other words, the return of the set of simulated P&Ls corresponding to the level of significance. Conditional VaRConditional Value at Risk (CVaR), also known as the expected shortfall, is a risk assessment measure that quantifies the amount of tail risk an investment portfolio has. CVaR is derived by taking a weighted average of the “extreme” losses in the tail of the distribution of possible returns, beyond the value at risk (VaR) cutoff point. Conditional Value at risk is used in portfolio optimization for effective risk management.
Conditional Value at Risk (CVaR) attempts to address the shortcomings of the VaR model, which is a statistical technique used to measure the level of financial risk within a firm or an investment portfolio over a specific time frame.
CVaR is the expected loss if that worst-case threshold is ever crossed. CVaR, in other words, quantifies the expected losses that occur beyond the VaR break point. Gaussian VaRThis method assumes that stock returns are normally distributed. It requires that we estimate only two factors—an expected (or average) return and a standard deviation—which allow us to plot a normal distribution curve.
As returns across different periods are close to uncorrelated, the variance of a T-day return should be T times the variance of a 1-day return. Hence, in terms of volatility (or standard deviation), Value-at-Risk can be adjusted as: ** VAR(T days) = VAR(1 day) x SQRT(T)**
To obtain the VaR for the stock, we multiply the cut-off by the standard deviation of the portfolio value, σ. The VaR is illustrated in the following figure:

VaR
Normal distributions are symmetric and completely described by 2 parameters: the mean and the standard deviation. The other benefit of the normal distribution is that the weighted average of variables that are normally distributed will also be normally distributed. So different stocks with normal distributions can be combined with the other stocks or securities with normal distributions, and the entire portfolio will be normally distributed.
The Cornish Fisher expansion (CF) is a way to transform a standard Gaussian random variable z into a non-Gaussian Z random variable. The method of calculation remains largely similar, only the Z-score is adjusted as per the following:

Where:
z = gaussian z-score
S = skewness
K = excess kurtosis
How MarketXLS Calculates Value-at-risk of your Portfolio
MarketXLS® completely automates the process of calculating the using excel to get the optimal portfolios which tend to lie along the efficient frontier.
The following inputs are required to be entered by the investor:
1. Symbol of the asset: Enter the ticker under which the security in your Portfolio is traded.
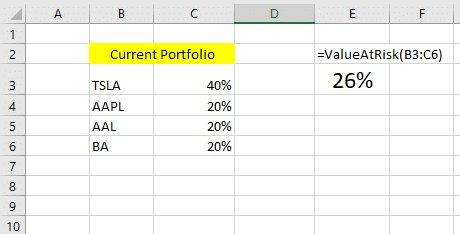
2. Weight of the asset in your Portfolio: Enter the percentage weight of each security, as shown below.
** Input:**

Value at risk of a portfolio
By default, MarketXLS assumes a 5% level of significance in the absence of any user input.
Months under observation:
To determine how many months you want to utilize retrospectively to arrive at your calculation, you may input the number of months you feel best, given that all the securities in your Portfolio have existed long enough to have data for those periods. Default Value: In the absence of any user input, MarketXLS uses the data for the preceding 12 months from the date of the query.
The investor can use the Value-at-risk of Portfolio excel formula to get an assessment for the determination of the cumulative risks within the portfolio. VaR modelling determines the potential for loss in the entity being assessed and the probability of occurrence for the defined loss. An investor gets to know the risk associated with the portfolio using VaR with MarketXLS.
Below is a quick summary of VaR Calculations in Excel with MarketXLS

Value-at-risk
