
In this article, we will learn about how to value stocks with DCF model in excel. The Discounted Cash Flow Model, or popularly known as the DCF Model, is one of the more widely used equity valuation models in the investment industry. The underlying principle behind the DCF valuation model is that a business is worth the present value of its expected future cash flows. So, we estimate the value of the business as the present value of its expected cash flows by discounting the future cash flows at a risk-adjusted discount rate. Once we arrive at the value of the business based on the DCF model, we can compare it with it’s current market value to determine whether it is undervalued or overvalued.
There are mainly three types of DCF models, namely, Dividend Discount Model (DDM), Free Cash Flow to Equity (FCFE), and Free Cash Flow to Firm (FCFF). In this article, we will build the DFC Model in Excel using Free Cash Flows to Firm (FCFF). The FCFF is the cash flow to all holders of capital in the firm, i.e., the equity holders and the bond holders.
**Our Approach **Our approach will be to:
-
Forecast the firm’s future free cash flows
-
Discount the cash flows using the firm’s weighted average cost of capital as the discount rate
-
Equity value will be the firm’s value minus debt value
Since it’s very difficult to forecast cash flows for too far in the future, we focus on forecasting annual cash flows for the near future (say 5 years). Beyond that we focus on forecasting the long-term growth rate. This will allow us to calculate a terminal value for the firm after, say, 5 years.
###Inputs to the DCF Model####**1. Forecasts of Future Cash Flows **Since we need a base, we start with initial cash flows which we can derive from the available financial statements.
The free cash flow can be calculated using the following formula:Free Cash Flow = EBIT(1-t) + Depreciation & Amortization – Changes WC – Capital ExpenditureWe then need to build the forecast of the cash flows. To do so, we forecast the near and long-term growth rates.
####**2. Discount Rate **To discount these cash flows, we use the weighted average cost of capital for the firm. This is because we are using the cash flows for the overall firm and not just equity. The WACC calculation requires many inputs and assumptions:
-** Capital Structure:Market value of debt and equity to arrive at the weights - Cost of Equity:Risk-free rate, Market risk premium and equity’s beta - Cost of Debt:**Pre-tax cost of debt and Effective tax rate
While some of these are assumption, we can find some of these information from reliable sources. There are free sources of information as well as premium sources (such as MarketXLS) which make it easy to access and use the information in your excel models.
Once we have all this information, we calculate the WACC using the following formula:** WACC = we*ke +wd*kd(1-t)**Where:
-
we is the equity weight in the capital structure
-
ke is the cost of equity
-
wd is the debt weight in the capital structure
-
kd is the cost of debt
####**3. Terminal Value **In addition to the cash flows for the short-term projection period (say 5 years), we need to estimate a terminal value for the firm which will reflect the value of the firm for all the years beyond our short term period of 5 years.
The terminal value can be calculated as the present value of a growing perpetuity using a long-term stable growth rate (g).** Vt = CFt (1+g)/(k-g)**Where:
-
CF is the cash flow
-
k is the discount rate (WACC)
-
g is the long-term growth rate
####**4. Present Value of All Cash Flows **Now that we have all the required data, we discount the forecasted cash flows and the terminal value to the present using WACC as the discount rate.
Especially relevant here is that the resulting value is the intrinsic value of the entire firm.
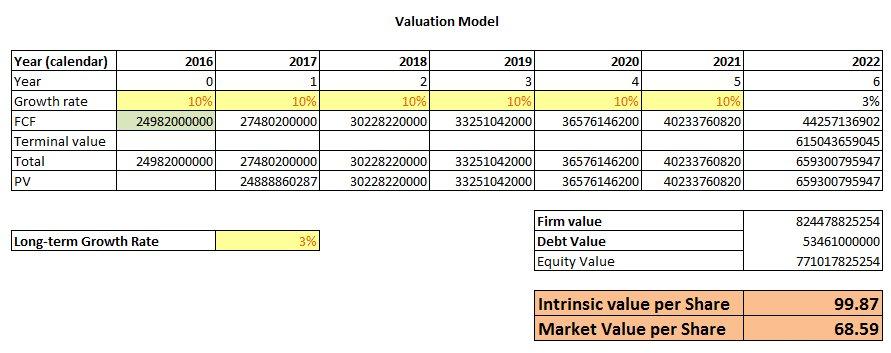
####**5. Intrinsic Value of the Stock **Since the value we got is the value of the entire firm, we first calculate the value of equity by subtracting the debt value from the firm value we calculated above:Equity Value = Firm Value – Debt valueThen we calculate the intrinsic value per share by dividing the equity value by the total outstanding shares.Intrinsic Value per Share = Equity Value / Outstanding SharesWe can compare the intrinsic value with the stock’s market value to know whether the stock is undervalued or overvalued.
###** DCF Model in Excel**
We have setup a simple to use DCF model in excel which you can download and use it for valuing any stock. You can also modify it as per your needs.
DCF Model in Excel
Here are a few important points about how to use the spreadsheet:
-
The model assumes a 5-year short-term growth period and then calculates the terminal value at the end of 5 years. You can easily tweak that to suit your requirements.
-
The cells marked in ‘Yellow’ are assumptions. Hence, the user should input this data.
-
In addition, The cells marked in ‘Green’ contain the actual market and fundamentals data for the stock. We fetch this data using MarketXLS’s historical fundamentals functions.
-
Finally, all the cells in ‘White’ are formulas for automatic calculations.
