Thinking Of A Takeover…Well How About ‘The Acquirer’S Multiple’

Meet The Ultimate Excel Solution for Investors
- Live Streaming Prices Prices in your Excel
- All historical (intraday) data in your Excel
- Real time option greeks and analytics in your Excel
- Leading data in Excel service for Investment Managers, RIAs, Asset Managers, Financial Analysts, and Individual Investors.
- Easy to use with formulas and pre-made sheets
The Acquirer’s Multiple – BackgroundMany people have heard of the infamous Magic Formula documented by Joel Greenblatt in his book “The Little Book That Beats the Market” which is a direct quantitative value investment model in ranking stocks by price and ROIC. In a similar nature, The Acquirer’s Multiple founded by Tobias Carlisle is a valuation technique, combining both value + quality in order to find the top 30 most attractive takeover candidates, based on the investment strategy described in his superb book “Deep Value: Why Activist and Other Contrarians Battle for Control of Losing Corporations.”
This is a form of Deep Value investing, and it was the original investment style that Warren Buffett used while he was learning under his mentor Benjamin Graham. In a nutshell, deep value investors are concerned about protecting their downside, and look for undervalued stocks with a large margin of safety between value and price – “Corporate gold dollars are now available for 50 cents or less – but they do have strings attached.” – Benjamin Graham (1932).
The Makeup of The Acquirer’s Multiple
The premise of the methodology is to examine several financial statement pieces such as debt, preferred stock, minority interests, interest, depreciation, and amortization. The actual formulation is:Enterprise Value / Operating Earnings (TTM)
You can use MarketXLS formulas like shown below to calculate The Acquirer’s Multiple.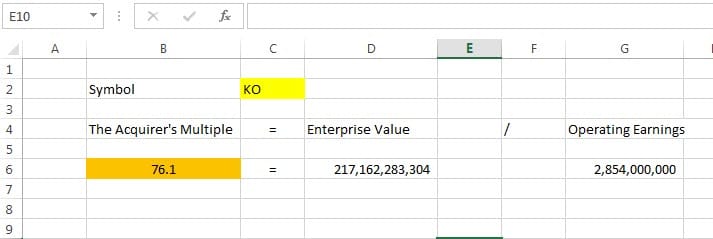
Using the same formulas, we calculated the Acquirer’s multiple for all of the S&P 500 stocks. Below are the top 10 companies with lowest figures.
For the Q2 2018, below is the full list of S&P stocks with their respective Acquirer’s Multiple Values. Negative values are ignored. Many other symbols were ignored for which the data could not be obtained. The following table is just an indicator of the concept and MUST NOT be relied on for any decision making.
The Enterprise Value is the total cost to buy out a company and it is calculated as:Market Cap + Preferred Equity + Non-controlling Interests + Total Debt – Cash and Cash Equivalents
The reason why we use this rather than just the Market Cap (Share price x Total Shares Outstanding) is that it includes additional liabilities such as debt, preferred equity and non-controlling interests which the owner will need to adjust for.
It uses Operating Earnings rather than EBIT, whilst similar have a distinction in that Operating Earnings is calculated from the top down whilst EBIT is constructed from the bottom up. This process allows us to use a variable that is standard and can be compared on a like for like basis across different companies, industries, and sectors.
Operating Earnings is calculated as:Revenue – (Costs of Goods sold + Selling, General and Admin costs + Depreciation and Amortization)
Interest repayments reduce earnings and are tax-deductible, so a company’s debt impacts it’s reported earnings and therefore removing this and tax allows us to compare companies with different capital structures.
Final Words
To sum up, this is a great process for identifying shares that have an optimal blend of value and quality in your chosen market that is not only simple but as effective as Joel Greenblatt’s Magic Formula. I would love to find out your thoughts and personal experiences on The Acquirer’s Multiple below…

I invite you to book a demo with me or my team to save time, enhance your investment research, and streamline your workflows.