Altman Z-Score is a score that indicates the solvency and debt repaying capacity of a company listed on a public exchange. This technique/template is usually used for publicly traded companies in the manufacturing sector. It is a barometer of the credit strength of a particular company.
New York University’s Finance professor Edward Altman defined and named the score in 1967. Since then, there were various evolutions in the score, and it has been a decisive measure of profitability and liquidity of a company.
Investors look at the Altman Z score to gauge the possibility of a firm going bankrupt in the near future. This model is a valuable predictor of the financial distress of firms. It has helped various investors of the Wall Street in deciding whether to invest in a company or not.
Past Performance of the Score
The score has evolved and developed over the years, which has resulted in an increase in its accuracy. From 1969 to 1975, Altman found 86 companies on the verge of bankruptcy using this score. In the 1976 to 1995 period, he found 110 companies and 120 companies in the upcoming three years. We can see that the number of financially distressed companies kept on increasing over the years. Majority of these companies were manufacturing companies. The accuracy in these years ranged from 82% – 94%
In 2012, he refined the score and came out with Altman Z Score Plus, which helped measure the credit risk of all types of companies.
Parameters of the Score
The five financial ratios used for calculating the Z Score are:
• Working Capital/ Total Assets
Negative working capital would indicate a low degree of liquidity and solvency, and positive working capital would indicate a high degree of the same.
• Retained Earnings/ Total Assets
This ratio shows the total amount of retained earnings out of the total assets.
• Earnings before Interest and Tax/ Total Assets
The EBIT ratio depicts a company’s ability to produce enough earnings to finance the expenses and operations and still be in profit.
• Market Value of Equity/ Total Assets
This ratio can be interpreted in terms of investor reliability in the company’s performance.
• Sales/ Total Assets
This ratio depicts the usage of assets to generate revenues.
Altman Z Score in MarketXLS
With the help of the Z score, investors can gauge the financial strength of the company. It highlights the possibility of the firm going bankrupt in the near future. MarketXLS provides its template for the calculation of the Z score. It also highlights the criteria and the formula using which the score has been calculated.
This score is significant for all those investors who are willing to invest in growth stocks. The primary reason behind this is that the growth stocks are the stocks of companies who usually have a good amount of leverage and debt in their balance sheet. This score helps assess whether this debt will affect the firm’s financial performance in the long term and there are any chances of bankruptcy in the future.
Let us have a look at the ready-to-use template provided by MarketXLS:
How to use the Template?
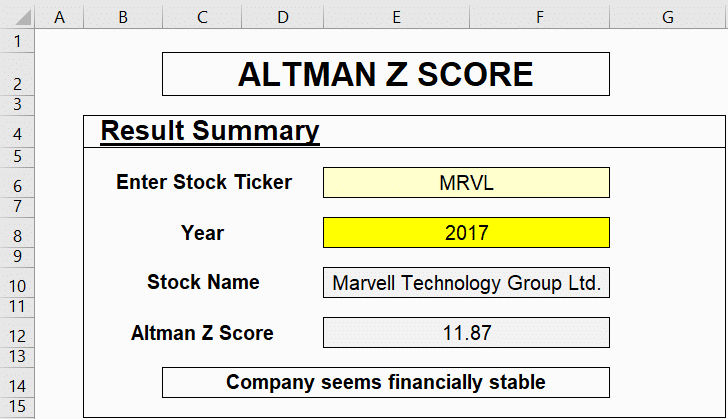
Enter the following information in the ‘Index’ Sheet to get the result summary:
• Stock Ticker in the cell E6
• Year of consideration in the cell E8
This sheet gives the Altman Z Score for the company and the template’s interpretation based on the score.
We have taken the example of Marvell Technology Group Ltd and the base year as 2017.
For detailed analysis, switch to the Calculations worksheet.
‘Calculations’ Sheet
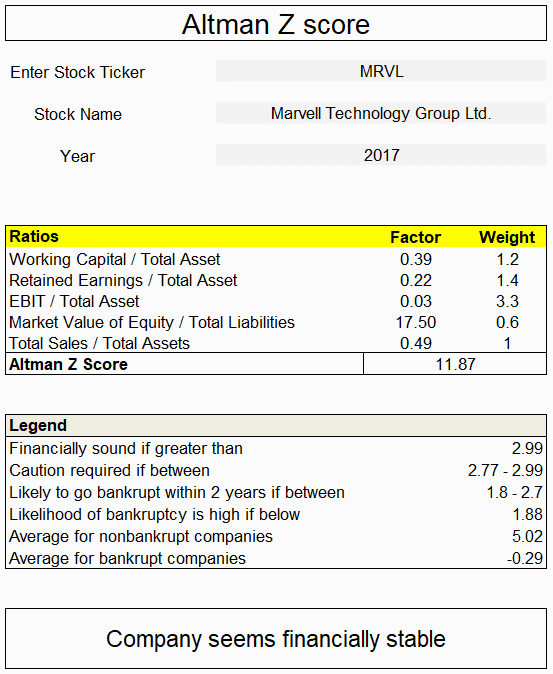
Here comes the main question; how is Z score calculated? Z score is calculated using the five financial ratios and adding their weighted products as per the below formula:
Z score = 1.2*A + 1.4*B +3.3*C + 0.6*D + 1*E
Where, A = Working Capital / Total Assets
B = Retained Earnings / Total Assets
C = EBIT / Total Assets
D = Market Value of Equity / Total Assets
E = Sales / Total Assets
How to interpret Z score?
The financial soundness of the firm can be gauged based on the below legend:
Financially sound if greater than 2.99
Caution required if between 2.77 – 2.99
Likely to go bankrupt within two years if between 1.8 – 2.7
Likelihood of bankruptcy is high if below 1.8
Average for non-bankrupt companies – 5.02
Average for bankrupt companies – (-0.29)
In this case, the Altman Z Score for MRVL stock is 11.87. This means that the company seems financially stable as it meets the criteria of the score.(These templates should not be considered as an advertisement or advice, professional or otherwise. You are requested to consider all the risk factors, including your financial condition, suitability to risk-return profile, and other similar conditions. These templates do not account for any professional advice but are merely some guidelines to explain the concept.)
The Bottom Line
The Altman Z Score has to be used with other templates/ models/ techniques for deciding on investment in a firm. This score tells about the solvency and the credit strength of the firm. For other measures like good financial strength and indicators, Piotroski Score and The Zweig Screen can be used along with this score. For gauging the dividend yield capacity of a blue-chip firm (or a firm that has a vast market capitalization), this score can be used along with The Weiss Blue Chip Dividend Yield Screen.
The link for these templates in MarketXLS are:
Piotroski F Score – https://marketxls.com/marketplace/product/piotroski-f-score-template/
The Zweig Screen – https://marketxls.com/template/zweig-screen/
The Weiss Blue Chip Dividend Yield Screen – https://marketxls.com/template/weiss-blue-chip-div-yield-screen/
For more such interesting information, visit https://marketxls.com/blog/
Disclaimer
None of the content published on marketxls.com constitutes a recommendation that any particular security, portfolio of securities, transaction, or investment strategy is suitable for any specific person.
The author is not offering any professional advice of any kind. The reader should consult a professional financial advisor to determine their suitability for any strategies discussed herein.
The article is written to help users collect the required information from various sources deemed to be an authority in their content. The trademarks, if any, are the property of their owners, and no representations are made. All trademarks referenced are the property of their respective owners. Other trademarks and trade names may be used in this document to refer to either the entity claiming the marks and names or their products. MarketXLS disclaims any proprietary interest in trademarks and trade names other than its own or affiliation with the trademark owner.
Welcome! I'm Ankur, the founder and CEO of MarketXLS. With more than ten years of experience, I have assisted over 2,500 customers in developing personalized investment research strategies and monitoring systems using Excel.
I invite you to book a demo with me or my team to save time, enhance your investment research, and streamline your workflows.
Implement "your own" investment strategies in Excel with thousands of MarketXLS functions and templates.
MarketXLS provides all the tools I need for in-depth stock analysis. It's user-friendly and constantly improving. A must-have for serious investors.
John D.
•
Financial Analyst
I have been using MarketXLS for the last 6+ years and they really enhanced the product every year and now in the journey of bringing in AI...
Kirubakaran K.
•
Investment Professional
MarketXLS is a powerful tool for financial modeling. It integrates seamlessly with Excel and provides real-time data.
David L.
•
Financial Analyst
I have used lots of stock and option information services. This is the only one which gives me what I need inside Excel.
Lloyd L.
•
Professional Trader
Meet The Ultimate Excel Solution for Investors
Live Streaming Prices in your Excel
All historical (intraday) data in your Excel
Real time option greeks and analytics in your Excel
Leading data service for Investment Managers, RIAs, Asset Managers