Altman’S Z Score In Excel Calculator (Includes Marketxls Template)
")
Meet The Ultimate Excel Solution for Investors
- Live Streaming Prices Prices in your Excel
- All historical (intraday) data in your Excel
- Real time option greeks and analytics in your Excel
- Leading data in Excel service for Investment Managers, RIAs, Asset Managers, Financial Analysts, and Individual Investors.
- Easy to use with formulas and pre-made sheets
What is Altman’s Z score and what it is used for?
In this article, I will provide you with a quick introduction to Altman Z score for public companies and how to calculate Altman z score in Excel using MarketXLS functions. Altman’s Z score is probably one of the more famous credit scoring models have survived 30 years of application more than that. Sometimes when a company enters bankruptcy it’s kind of thing that people have seen it months or even years coming. But sometimes it’s just a complete surprise. We all know examples of some companies that just imploded and people did not see coming, and investors in people end up losing millions and billions of dollars.
So, what if there was a way to predict the bankruptcy. There was a way and by looking at some financial numbers we could get an idea if there is a likelihood of a company going bankrupt, even if there may be other people were not quite seeing that coming. So that’s really was what Altman’s Z score was developed for, it’s basically a formula that outputs the z score and then that score can be an indicator to suggest if the company is at a high risk of going bankruptcy or not.
This model was created by combining five different financial ratios, calculated by using the accounting data of those companies that had already gone bankrupt in the past. The model itself was developed in 1968 but it is still one of the most widely used models.
Download the Altmans Z Score Calculator in MarketXLS
It is a long formula but it is not very difficult to calculate once you have all the numbers. Altman’s Z score is a linear discriminant model, that means it divides potential borrowers into two classes, either high risk or low risk. This score does not directly produce a probability of going bankrupt however you can take this score map it to a credit rating and translate that credit rating to a probable default. This score is essentially a credit classification model. The idea is, that we take a look at some fundamental variables and essentially plug these into a linear function to produce the Altman Z score in Excel.
How is the score Calculated?
Following equation is used to calculate the score.
 alt="Altman’S Z Score In Excel Calculator (Includes Marketxls Template)">
1)
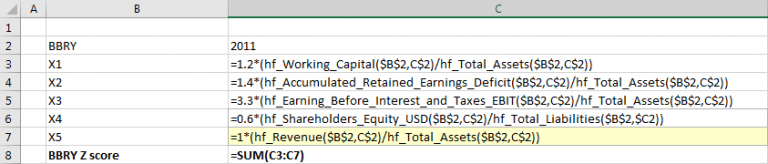
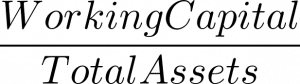 Working Capital is Current Assets minus the current liabilities. BBRY is at cell B2 and Year is at cell C2.
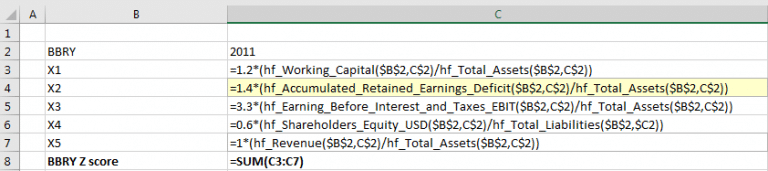
Using MarketXLS functions you can calculate this factor as highlighted below in Yellow.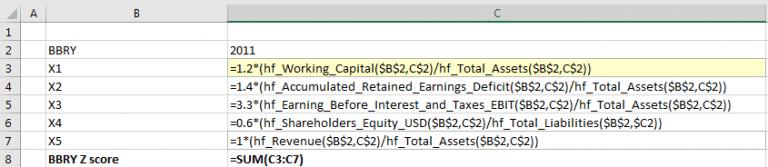 alt="Altman’S Z Score In Excel Calculator (Includes Marketxls Template)">
2)
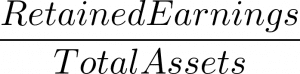 Part of that theory here is that the younger companies would have less of the tenure to accumulate retained earnings so there a little bit more likely to default compared to the older companies.
 alt="Altman’S Z Score In Excel Calculator (Includes Marketxls Template)">
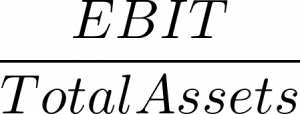
3)
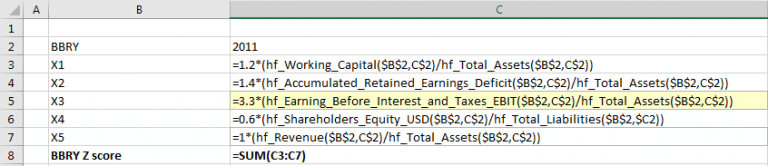 alt="Altman’S Z Score In Excel Calculator (Includes Marketxls Template)">
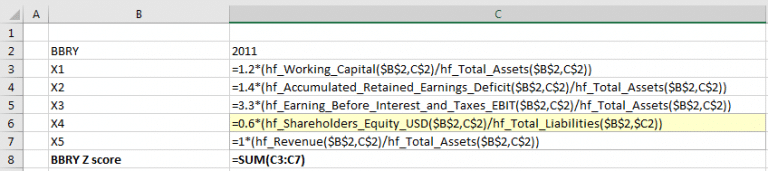
4)
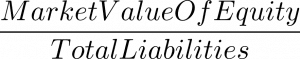 This factor major has much in common with the structural approach to the credit risk. As the market value of equity reduces company has less of a cushion to pay back its liabilities so its much more likely to default.
 alt="Altman’S Z Score In Excel Calculator (Includes Marketxls Template)">
5)
 alt="Altman’S Z Score In Excel Calculator (Includes Marketxls Template)">
How do we now interpret the result?
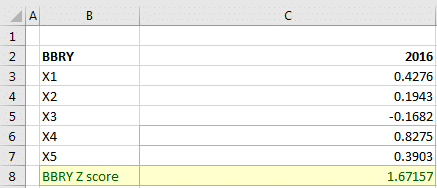
If the score is higher than 2.99 it means that the possibility of company’s bankruptcy is very low. This interval is known as safe zone. The value between 1.8 and 2.99 represent a Grey zone, suggesting that company is facing some kind of financial stress.
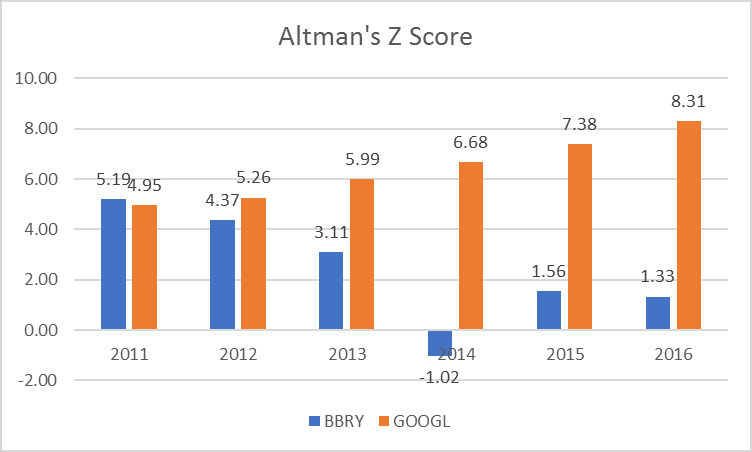
If the value is below 1.8, the possibility of the company’s bankruptcy is high. This group is known as the distress zone.In our example for the period ending 2016 BBRY was under some kind of financial stress. Once I had this model I could simply replicate this for other companies. So, I compared the BBRY with GOOGL for Altsman Z score for the period of 2011 to 2016 and plot the scores.
Please however note, that this model does not calculate the exact probability of company’s bankruptcy. It is more of a statistics-based model. So, you cannot rely on it alone. But looked along with credit rating of the company it could provide good indication of financial health of a company.
Google is consistently getting higher and higher and that of BBRY is going the other way down. I based the model on Yearly numbers, however with MarketXLS you can calculate the same by quarter. All you have to do is add one more argument in functions for quarter. More details on how to use MarketXLS hf functions, please see our knowledge-base here.
With the Altman Z score in Excel model in place, I went on to find a company that filed for Bankruptcy in recent time so I could check if this score can validate itself if we put into the model the numbers from that company.
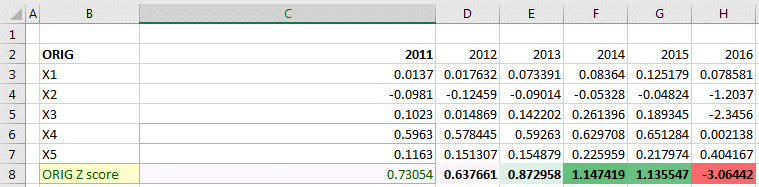
So, i found the article below…https://seekingalpha.com/article/4058519-ocean-rig-files-bankruptcy about Ocean Rig with the symbol of ORIG.
So, I ran the same model with ORIG and found the results below. The results seem to indicate that the Altman’s Z score is a valid indicator of possible bankruptcy of a company.
 alt="Altman’S Z Score In Excel Calculator (Includes Marketxls Template)">


I invite you to book a demo with me or my team to save time, enhance your investment research, and streamline your workflows.