
!
The Binomial Option Pricing Model Excel is available as a template with MarketXLS. The Binomial Option Pricing Model is a popular model for stock options evaluation, and to calculate the options premium.
The Binomial Options Pricing Model provides investors with a tool to help evaluate stock options. The model uses multiple periods to value the option. For each period, the model simulates the options premium at two possibilities of price movement (up or down). The periods create a binomial tree — In the tree, each tree shows the two possible outcomes or the movement of the price.
*/}(https://marketxls.com/blog/wp-content/uploads/2020/07/1.gif)
The model creates a binomial distribution of possible stock prices for the option. It creates possible paths that the stock price could go until the expiration date and the resulting impact on the options premium. Unlike the Black Scholes model of valuation of the option premium, the Binomial model gives you a view of an option contract at different prices at different periods until the expiration date.
**Black-Scholes Vs Binomial Model **Black-Scholes model"assumes that the option contract you are pricing is a European style option contract. A European style option contract is the one that can only be exercised at the date of the Expiry. The Americal style options contracts are the ones that can be exercised on any day until the expiry. Unlike, the Black Scholes model the Binomial option pricing model excel calculates the price of the option at various periods until the expiry. Since most of the exchange-traded options are American style options, the Black Scholes model seems to have a limitation.
If you were to assume that each period (days/weeks/months) until the expiry is the expiry date itself, you could also use the Black Scholes model to calculate a similar pay off table showing the value of the option for each period until expiry.
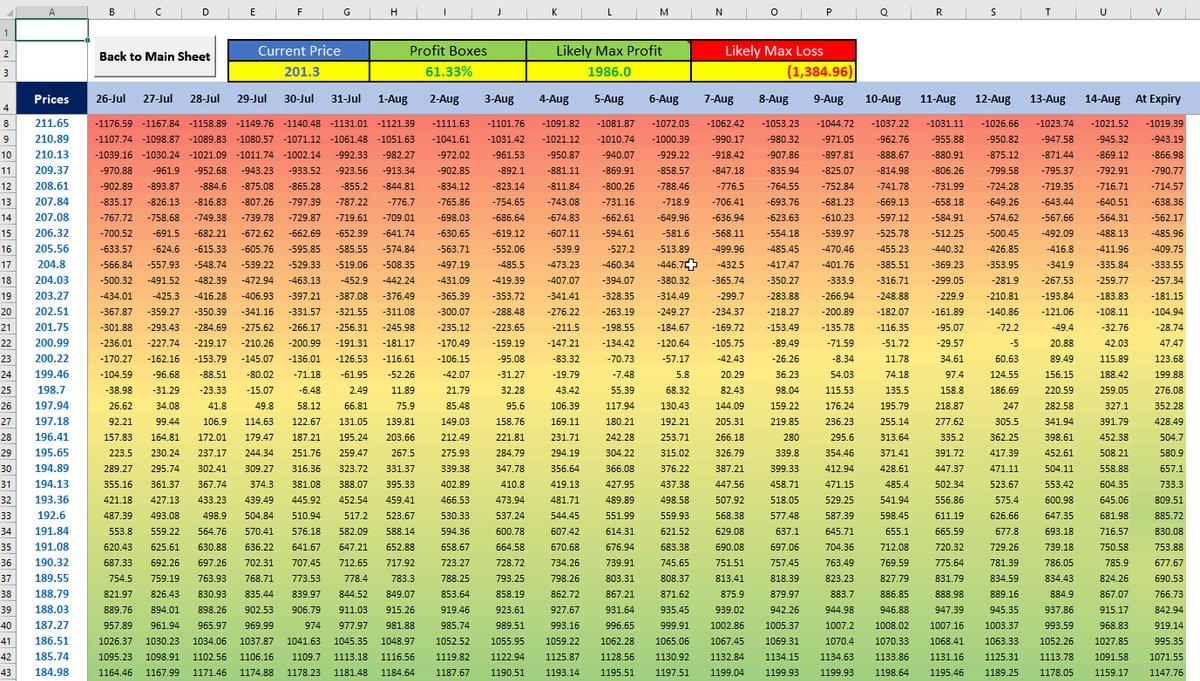
See the example below, where I use the Black Scholes model to generate a payoff for an option contract until the expiry date by assuming each day until the expiry is the expiry date. You can refer to our Options Profit Calculator template here.
Binomial Option Model vs Black Scholes Option Model
###** How do you calculate the Option Premiums using the Binomial Model?**
The Binomial Option Pricing Model Excel takes the following as the Inputs. For example, I have taken a Call Option of American Airlines expiring on August 7th, 2020 and today is 29th of July 2020. So, there are 10 days left until the expiry. The variable T as shown below in the days to expiry and n is the number of steps that we need in our Binomial tree. The current price of this option is 0.54 per contract. And the stock price is at 11.77. The following table shows other values and assumptions.
S = 11.77 #underlying pricek = 12 #Strike pricer = .04 #Riskfree ratev = .81 #VolatilityT = 10./365 #Time to maturityn = 10 #StepsUn= 1 #1 Unit is 100 stocksPC = 0 #Call option
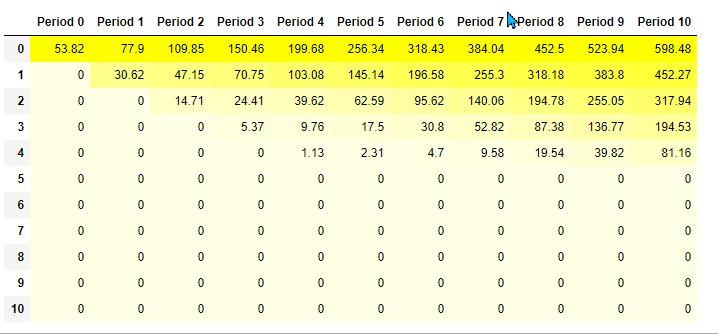
The first step in the calculation is to create a binomial tree. This tree will have a specified amount of time that ends at the expiration date. Each point on the tree is a node. And each node is the price the stock can go at. The following image shows the binomial tree for the stock price movement(in table 1). So, for each period the table below shows the possible price movement on the underlying stock.
This chart below is the table for the price of the stock and the one below it is the table for the price of the option contract at corresponding prices (in table 2). And finally we have a table that shows the expected payoffs (in dollars) at these prices (in table 3) until the expiry when we buy 1 contract of this call option.
TABLE 1:
!
TABLE 2:
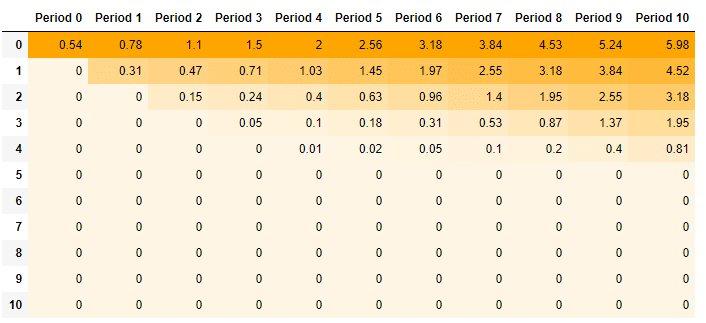
Binomial Option Model - Option Premium
TABLE 3:
Binomial Model PayOff Table
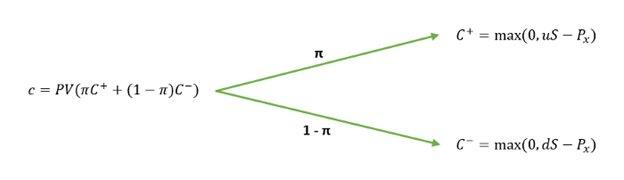
The binomial tree diagram represents the option payoff and probability at different nodes. Nodes outline the paths the price of the underlying asset may take over time. The following binomial tree represents the general one-period call option.
Binomial Option Pricing Model Excel
The option value using the one-period binomial option pricing model can be worked out using the following formula:
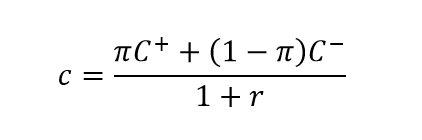
Binomial Option Pricing Model Excel
The put option uses the same formula as the call option:
Where:
C+ is the payoff of an up move;
C- is the payoff of the down move;
π is the probability of an up move;
1-π is the probability of the down move;
r is the discount rate.
Where π is the probability of an up move which is determined using the following equation:
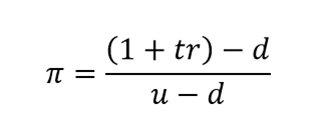
Binomial Option Pricing Model Excel
Where:
t is the period multiplier (time to maturity);
r is the discount rate;
d is the down factor;
u is the up factor.
The binomial option pricing model excel is useful for options traders to help estimate the theoretical values of options. Price movements of the underlying stocks provide insight into the values of options premium. The model offers a calculation of what the price of an option contract could be worth today.
