ROIC Formula: How to Calculate Return on Invested Capital (ROIC)?
To calculate a company’s profitability, investors use Return on Invested Capital (ROIC), which measures the effectiveness of the company’s use of its invested capital to generate profits. The ROIC formula involves dividing the after-tax operating income of a company by its total invested capital. By comparing a company’s financial performance over time and to other firms in the same industry using the ROIC formula, investors can gauge the efficiency of its use of capital. So, a higher ROIC indicates more efficient use of capital, which may lead to better returns for investors.
Maximizing ROIC: Strategies for Companies
To maximize ROIC, companies can adopt various strategies to increase their return factors while minimizing negative factors. One of the key strategies involves increasing operating margins and reducing the invested capital. Another approach is to focus on driving sales growth while reducing operating expenses. Moreover, the Companies can also use the ROIC formula to increase their net income and lower their cost of capital. Additionally, leveraging assets responsibly can help increase returns while minimizing risks associated with them. Overall, by utilizing these strategies, companies can effectively maximize their ROIC and generate better returns for investors.
How can MarketXLS Help?
MarketXLS is an automated investment decision-making platform that offers a variety of data and analytics tools for investors and traders. To calculate ROIC formula, these tools include real-time market and news data, technical and fundamental analysis, stock and financial market reports, and risk/return analysis. By leveraging these tools, investors can make more informed trading decisions and automate portfolio management, saving both time and money when it comes to investment decisions.
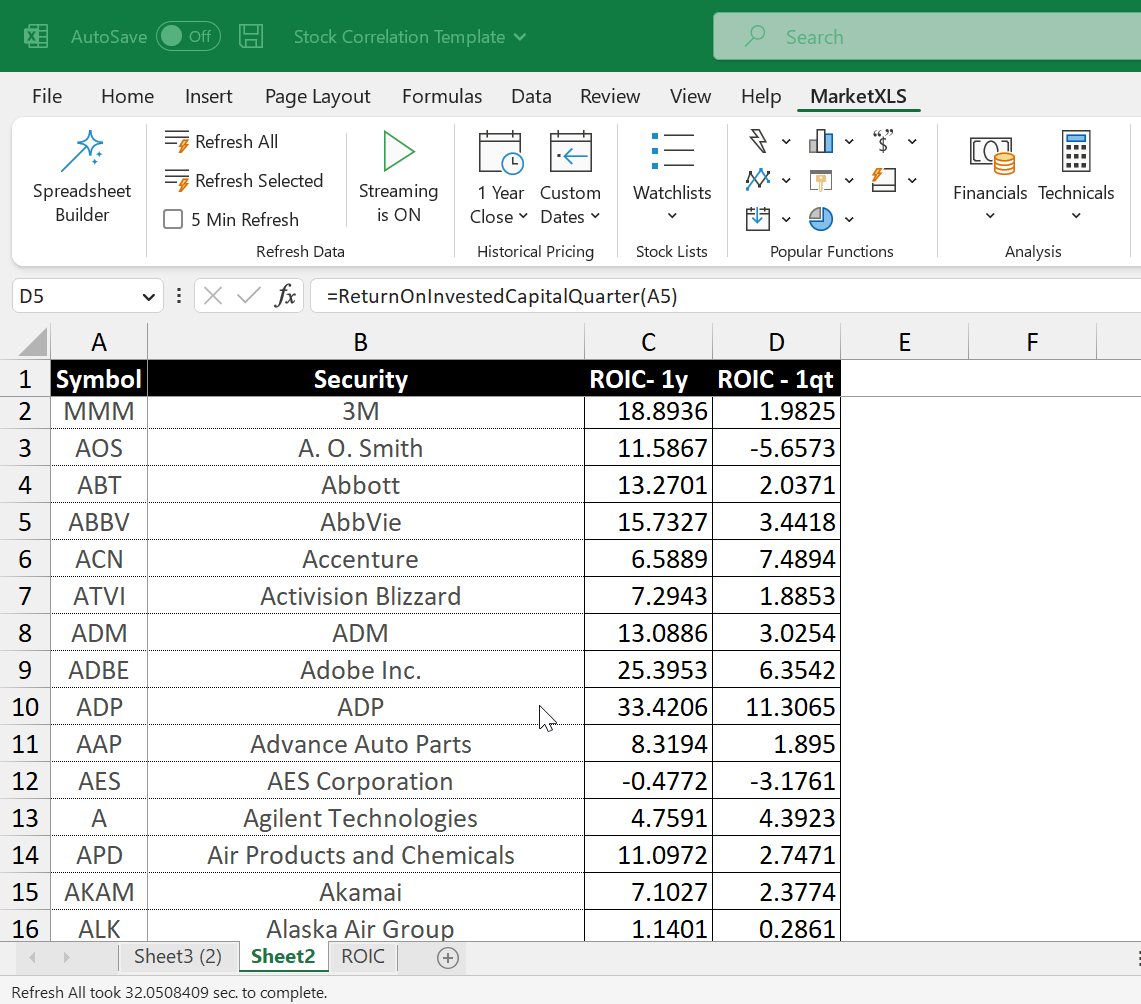
So, The Return on Invested Capital function (ROIC formula) on MarketXLS is given as:
=ReturnOnInvestedCapitalOneYear(“MSFT”)
=ReturnOnInvestedCapitalQuarter(“MSFT”)
Moreover, MarketXLS provides several functions that can be useful for analyzing ROIC, including the ROIC formula as well as other functions mentioned below:
| Function Title | Function Example | Function Result |
|---|---|---|
| Invested Capital | =hf_Invested_Capital(“MSFT”,2022) – Returns the value for the year 2022. |
Return on invested capital (ROIC) measures how well a firm uses its capital to generate profits. |
| Return on Invested Capital (TTM) | =ReturnOnInvestedCapitalOneYear(“MSFT”) | It is a metric which shows profit generated per value of capital employed in a last 12 months |
| Average True Range | =AverageTrueRange(“MSFT”) – Returns ATR value for 14 day period |
A stock with a high level of volatility has a higher ATR, and a low volatility stock has a lower ATR. |
To help you navigate and utilize MarketXLS effectively, there is an AI-driven search for all functions available on the website.: https://marketxls.com/functions
Download from the link below, a sample spreadsheet created with MarketXLS Spreadsheet builder
However, note that this spreadsheet will pull the latest data only if you have MarketXLS installed. If you don’t have MarketXLS, you can consider subscribing through the link provided. here
https://mxls-templates.s3.us-west-2.amazonaws.com/MarketXLS-Model-ID-lIOpyY.xlsx
To learn more about the ROIC formula, you can also read relevant blogs.
Thinking Of A Takeover…Well How About ‘The Acquirer’S Multiple’

