")
What can you expect from this article?
1. A brief about the book itself- Buffetology.
Buffetology
Mr. Warren Buffett is the most renowned investor of all time. I doubt there is any finance enthusiast on this planet who has not heard about him or his investing style. His former daughter-in-law, Mary Buffett, wrote a book named “Buffettology,” She thoroughly discussed Buffet’s various investing styles’ basic tenets. EPS Growth is one of the parameters that Mr. Buffett likes to look at while picking stocks.
EPS
EPS stands for earning per share, which means how much a shareholder will make per share if the company decides to distribute all its earnings. EPS indicates a company’s profitability. More the ratio more is the company’s earnings and hence better the financial health of the company. It can be used to compare a company with its peers.

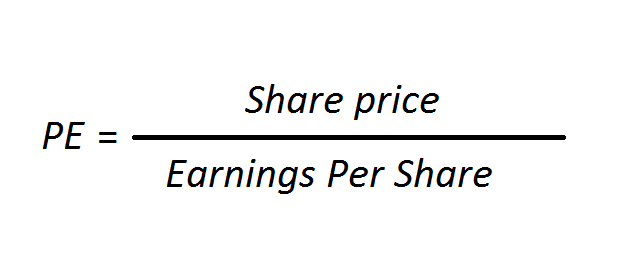
P/E ratio
P/E stands for the price to earnings ratio, which tells the price investors are willing to pay for each dollar in earnings. The primary aspect of this ratio is to find the valuation of a company. In layman’s terms, to find if a company is overpriced or under-priced. When used alone, PE ratio can be misleading. However, a high PE often suggests that a stock is overvalued and vice versa.
How to use it?
The main idea is to value a company based on its past earnings. That being said, PE alone can be misleading while predicting the future price of a stock. Therefore, it makes sense to combine it with a growth parameter, which is the EPS. Let’s see how Mr. Buffett does it.
In this method, Buffett analyses the company’s long-term growth trend to determine how it may perform in the next 10 years. He takes a combination of two metrics – EPS and P/E.
Firstly, He shortlists the stocks whose average earnings growth rate has been more than 15% over the past 5 to 10 years. Then, He takes the EPS growth of the last ten years and projects the next ten years’ growth. Similarly, He determines the average P/E ratio of the last 10 years and multiplies it with the next 10th year EPS to determine the stock price. Finally, He determines the return rate on the stock, taking the current price as entry and estimated price as an exit. If the estimated return rate comes out to be greater than 15%, he only shortlists that stock for investment.
Let’s understand this using an example:
Let’s suppose any company’s EPS is $4.62 and has been growing at an average rate of 17.6% per year. As per the forecast, it will be $23.37 in 10 years from here.
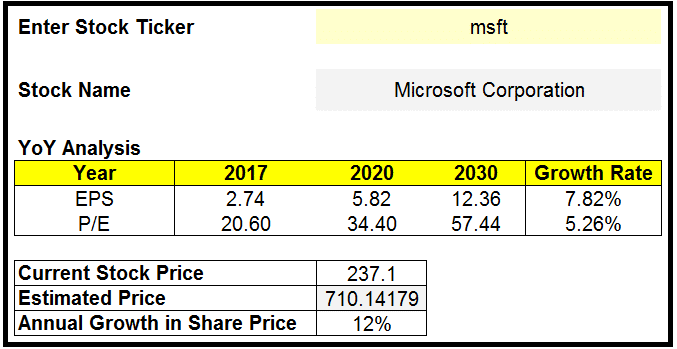
Pick stocks using MS excel
Below is an MS excel template that our website provides for the valuation of a company based on EPS growth. You just enter the ticker symbol of the stock you are interested in and the template gives you the future stock price and the growth rate y-o-y. I took MSFT as an example. The current stock price is $237.1 and if everything goes fine the price will increase to about $710 by 2030. However, the growth rate of 12% doesn’t conform to the cut-off set by Buffet, which is 15%. Mr.Buffet will surely not consider this investment but 12% is not that bad either.
Disclaimer
None of the content published on marketxls.com constitutes a recommendation that any particular security, portfolio of securities, transaction, or investment strategy is suitable for any specific person.
The author is not offering any professional advice of any kind. The reader should consult a professional financial advisor to determine their suitability for any strategies discussed herein.
the article is written for helping users collect the required information from various sources deemed to be an authority in their content. The trademarks if any are the property of their owners and no representations are made.
References
Learn more about Guru screens here.
