Weiss Blue-Chip Dividend Yield Screen – Tracking And Implementation

Meet The Ultimate Excel Solution for Investors
- Live Streaming Prices Prices in your Excel
- All historical (intraday) data in your Excel
- Real time option greeks and analytics in your Excel
- Leading data in Excel service for Investment Managers, RIAs, Asset Managers, Financial Analysts, and Individual Investors.
- Easy to use with formulas and pre-made sheets
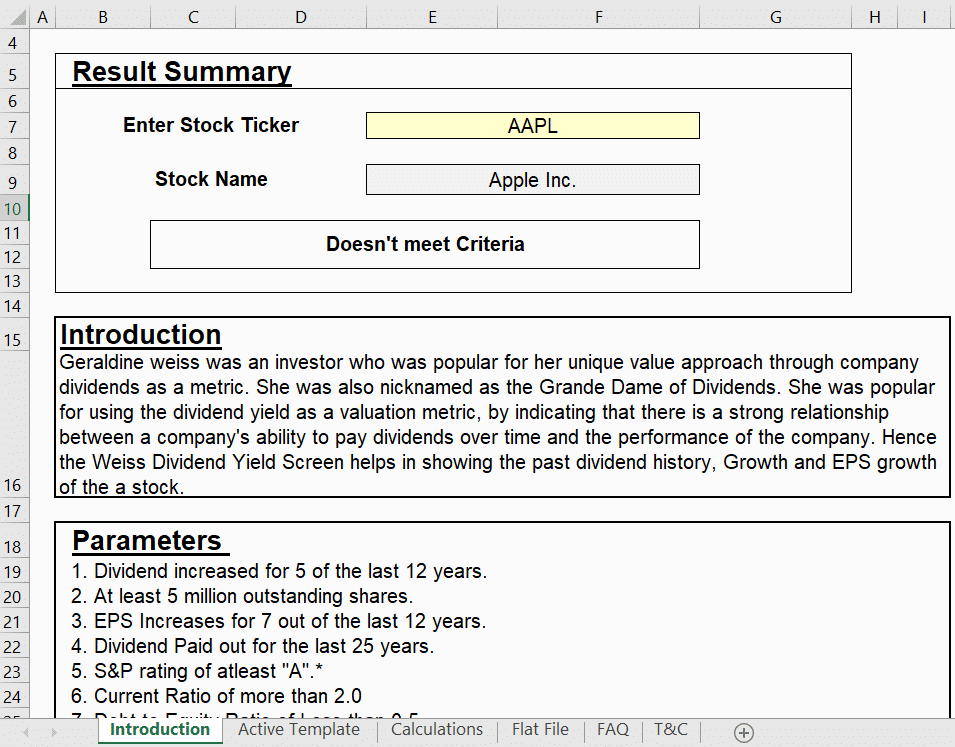
Introduction
In 1988 Geraldine Weiss, renowned as ‘The Dividend Detective,’ wrote the classic ‘Dividends Don’t Lie’, which centralized on the Dividend-Yield Theory as a method of mastering Value Investing. According to her, dividends determine the actual value of a blue-chip company. She disagreed with the theory of valuing a company based on its P/E (earnings) because earnings can be manipulated. Finally, she concluded that a dividend given by a blue-chip company, i.e., the dividend yield of a blue-chip company, is an accurate recognition of the company’s value. The Weiss Blue-Chip Dividend Yield Screen entails screening publicly available data on several stocks using predetermined criteria. This enables individuals to filter out all those blue-chip companies who regularly provide dividends and meet the requirements/parameters of the screen.
Understanding the needs of an investor who wants to invest in blue-chip stocks, MarketXLS has provided a ready-to-use Wiess Blue-Chip Dividend Yield Screen for facilitating all those investors who wish to invest their money in blue-chip stocks.
But before going straight to the template, let’s understand a couple of basic terminologies.
What are Blue-Chip Stocks?
Blue-chip stocks are the stocks of large, financially sound companies having an exceptional reputation. These companies are one of the industry leaders of their industry. They are large-cap stocks having market capitalization in billions. Most of these stocks are a dream of many investors. The term blue chip is supposedly derived from poker, in which blue chips are the most expensive chips.
Some of the examples of these stocks would include Alphabet, Amazon & Apple.
What is Dividend Yield?
The dividend yield is a financial ratio that expresses a company’s value based on the declaration of dividend by it. It is a widely used ratio in the stock market by investors.
It shows how much dividend per share a company pays to its investors each year in relation to its stock price.
Formula: Dividend per share/Price at which the stock is trading
The Parameters of the Screen
She was famous for using the dividend yield as a valuation metric by indicating a strong relationship between a company’s ability to pay dividends over time and its performance. Hence the Weiss Dividend Yield Screen helps in showing the past dividend history, growth, and EPS growth of the stock. There are specific parameters that a stock has to meet.
The screen focusses on four criteria: Growth, Quality, Financial Strength and Sentiment
Let us have a look at those parameters:
• Dividend increased for 5 out of the last 12 years (Growth)
• At least 5 million outstanding shares (Sentiment)
• EPS Increases for 7 out of the previous 12 years (Growth)
• Dividend Paid out for the last 25 years (Quality)
• S&P rating of at least “A” (Sentiment)
• A current ratio of more than 2.0 (Financial Strength)
• Debt to Equity Ratio of Less than 0.5 (Financial Strength)
• Dividend Payout Ratio of less than 50% (Financial Strength)
Weiss Blue-Chip Dividend Yield Screen in MarketXLS
MarketXLS has a ready template for this screen using which you can identify those blue-chip stocks that meet the screen parameters and have the potential to see growth in the future.
The software explains the screen and the fundamentals required for a stock to meet the Blue-chip Dividend Yield Screen criteria. It consists of various complex functions.
How To Use The Template?
The first sheet of the template, named ‘Introduction,’ contains all the information you require to use the screen.
In this sheet, you have to enter the stock ticker in cell E7, based on which other calculations will be made in the ‘Active Template’ sheet.
We have taken an example of the Apple Company.

The ‘Active Template’ sheet calculates and checks whether the stock ticker which you entered meets the criteria of the screen or not.
It enters the criteria check result in column ‘E’ based on the stock’s parameters.
In this example, Apple doesn’t meet the criteria of the Weiss Blue-Chip Dividend Yield Screen because of the following reasons:
• The stock has paid dividends only in 9 years out of the past 25 years. To meet the criteria, it should have paid dividends in the past 25 years.
• The current ratio of the ‘AAPL’ stock is 1.2, which is less than two. It should be above two to meet the criteria of the screen.
• Debt to Equity Ratio is greater than 0.5.
But there is a point to note; the screen will not enter the result of the parameter ‘S&P Ratings.’ The ‘S&P Ratings’ can be fetched from the link given in the template.
The Bottom Line
This template considers the Dividend growth, history, EPS, and a few other ratios to ascertain the growth and value in a stock. Weiss believes that dividend help to separate the speculators from the investor. Hence this template tracks the past 25 years of Dividend history of the stock and matches the stock’s EPS and dividend growth with the given parameters to know if it is suitable for investing.
Like every tool in the stock market has a limitation, this one also has. This strategy depends on past data and does not guarantee the continuity of the same results in the future.
Disclaimer
None of the content published on marketxls.com constitutes a recommendation that any particular security, portfolio of securities, transaction, or investment strategy is suitable for any specific person.
The author is not offering any professional advice of any kind. The reader should consult a professional financial advisor to determine their suitability for any strategies discussed herein.
The article is written to help users collect the required information from various sources deemed to be an authority in their content. The trademarks, if any, are the property of their owners, and no representations are made. All trademarks referenced are the property of their respective owners. Other trademarks and trade names may be used in this document to refer to either the entity claiming the marks and names or their products. MarketXLS disclaims any proprietary interest in trademarks and trade names other than its own or affiliation with the trademark owner.
Reference
https://www.stockscreening101.com/investing-strategy-dividend-yield.html

I invite you to book a demo with me or my team to save time, enhance your investment research, and streamline your workflows.