")
A long diagonal spread with call options refers to the strategy of buying one long-term call with a lower strike price and selling one short-term call with a higher strike price.
A call diagonal can be thought of as a two-part strategy. It is a cross between a long calendar spread and a short credit call spread. Having features of both these strategies, in itself, diagonal spreads is quite an advanced strategy. Diagonal spreads can be of several types: Long, short, bearish, bullish, calls, or puts. Here we will mainly talk about long call option diagonal spreads.
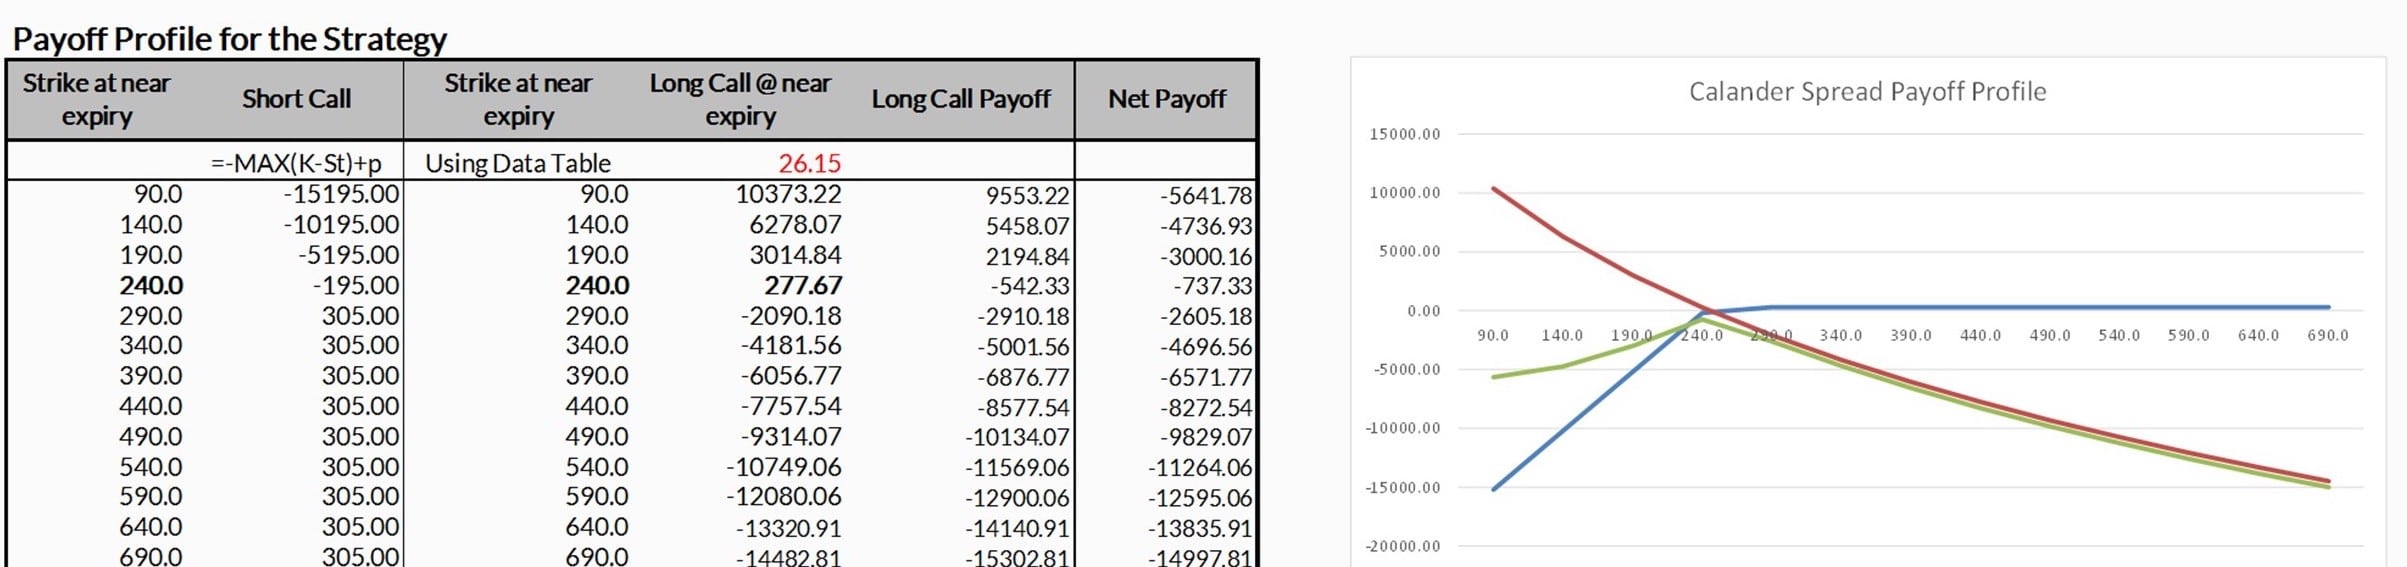
Profit, Loss, Breakeven
The maximum profit in this strategy is realised if the stock price is equal to the short call’s strike price on the expiration date of the short call. The maximum risk occurs when if the stock price falls sharply below the long call’s strike price. The option reaches the breakeven point, which appears below the strike price of the short call. At the expiration of the short call, the breakeven point is achieved when the long call’s price equals the spread’s net cost. However, it is impossible to know where exactly the breakeven point will lie because it depends entirely on the price of the long call, which depends on the level of volatility in the market.
Let us understand how we can use the MarketXLS template to understand a diagonal spread:
This strategy is mainly used to buy stocks by going long on a far-out call option and going short on a near-term short option as the market goes up.
Below is a screenshot of the diagonal spreads template on MarketXLS.
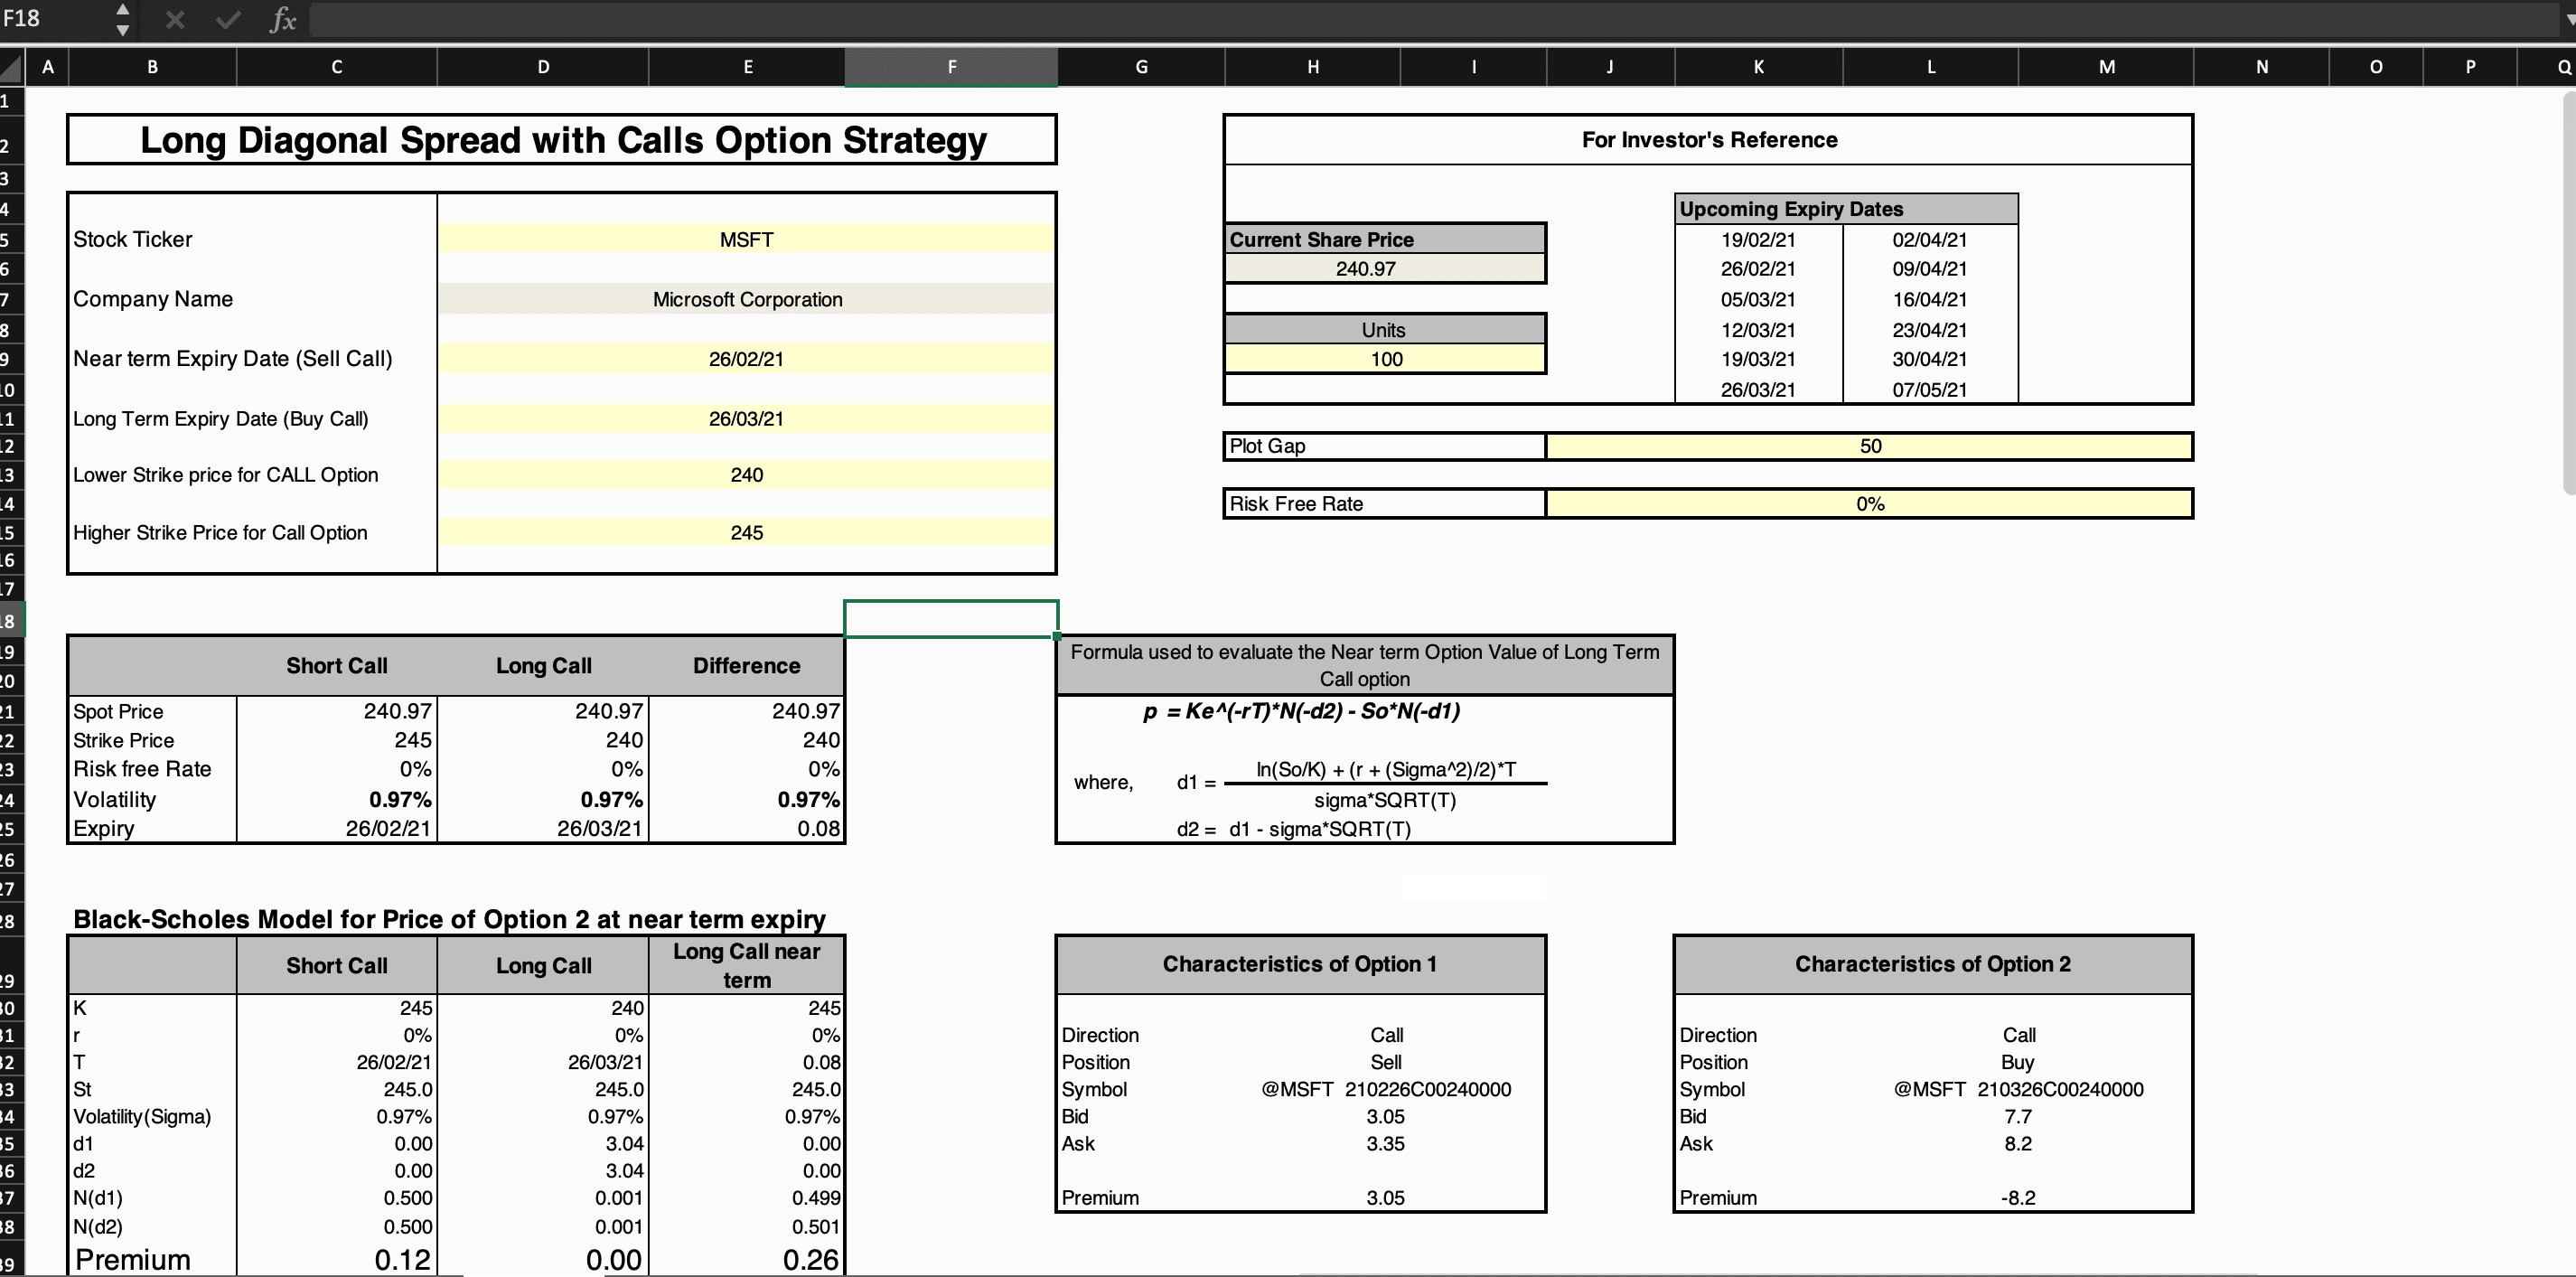
- Enter the stock ticker in cell E5
- Mention the strike prices-, short- and long-term expiry of call options in D13, D15, D9, and D11, respectively.
- Users can specify the risk-free rate.
- Update the Plot Gap based on your requirement of the payoff profile.
Here is an example showing how it is to be done:
Understanding the market forecast:
A diagonal spread with calls will realise its maximum profit when the stock price equals the short call’s strike price on the expiration date of the short call.
If the stock price is at (or close to) the strike price of the short call when the position is set upon, then the forecast must be for a “neutral price” action.
If the stock price is initially below the strike price of the call when the position is established, then the expected forecast must be for the stock price to rise to the level of the strike price at expiration (modestly bullish).
When to use this strategy?
Patience and attention to detail are required while using this strategy. Even a small change in stock prices can significantly impact the price of a diagonal spread.
Volatility:
Since vega decreases as the expiration of an option approaches, a long call diagonal spread usually has a net positive vega when the call position is first established. Accordingly, rising volatility generally helps the position, and falling volatility hurts typically. The vega is highest when the stock price is equal to the strike price of the long call, and it is lowest when the stock price is equal to the strike price of the short call.
Time:
Long call diagonal spreads generally have a negative theta when first established. The theta is most negative when the stock price is close to the strike price of the long call, and it is the least negative or possibly even positive when the stock price nears the strike price of the short call.
Stock Price:
Delta is used to estimate how much a position will change if the stock price changes. Long calls have negative deltas, and short calls have positive deltas. A diagonal spread, when first established, usually has a net positive delta. With changes in the stock price over time, the net delta varies from slightly negative to approximately +0.90, depending on the relationship between the stock price to the strike prices of the calls and the time to expiration of the short call.
Conclusion
Trading in diagonal spreads with call options can be somewhat tricky, especially for beginners. The templates provided by MarketXLS are easy to use and time-saving. We should also keep a few points in mind while playing this strategy:
- Try to use small net credit when entering this trade because this will minimize the security’s directional risk.
- It is better to close the spreads entirely at the front month expiration itself.
- Loss can occur at either side of the strike price if the underlying price moves away from call options’ strike price. However, the downside is lower than the Naked Call option.
References:
