Long Diagonal Spread With Puts Option Strategy(Excel Template)
")
Meet The Ultimate Excel Solution for Investors
- Live Streaming Prices Prices in your Excel
- All historical (intraday) data in your Excel
- Real time option greeks and analytics in your Excel
- Leading data in Excel service for Investment Managers, RIAs, Asset Managers, Financial Analysts, and Individual Investors.
- Easy to use with formulas and pre-made sheets
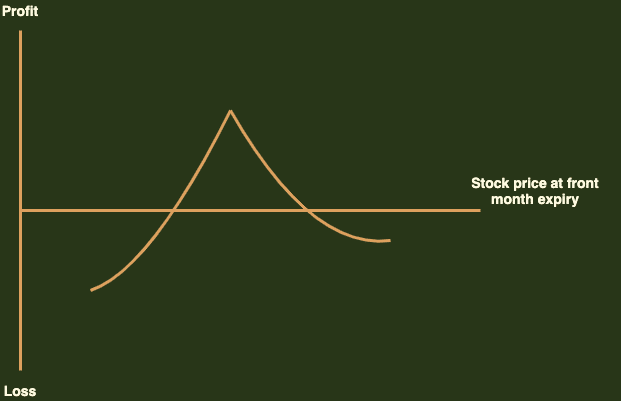
A long diagonal spread with puts is an options strategy created by buying a long term put having a higher strike price and selling a short term put having a lower strike price. This strategy is used to profit from neutral stock price action at the strike price. The maximum profit that can be realised occurs when the stock price of the underlying asset is equal to the strike price of the short put on a day of expiration. On the other hand, the full risk involved occurs when the stock price rises sharply above the long put option’s strike price.
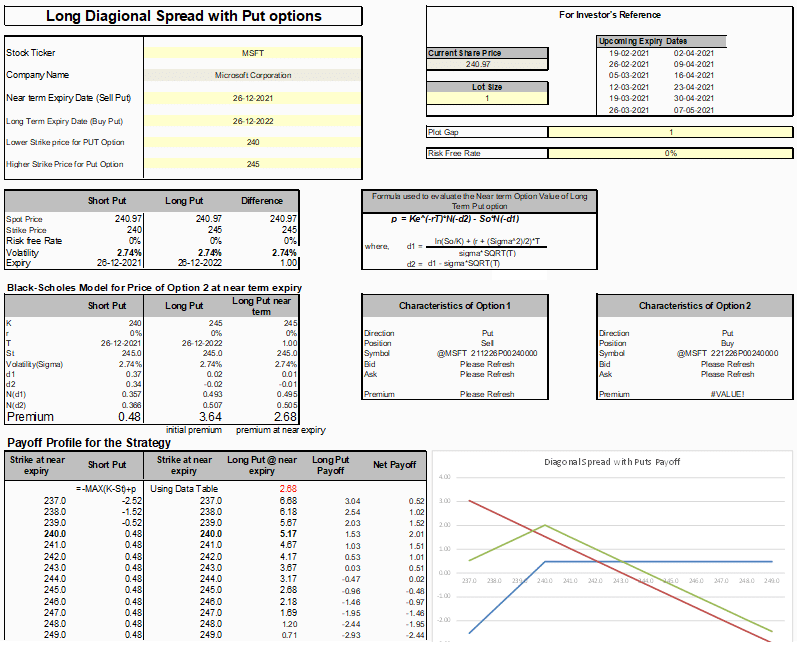
Let us see how we can use the MarketXLS Template to understand long diagonal spread with puts better:
In the template provided
* Enter the stock ticker in cell E5
* Mention the strike prices-, short- and long-term expiry of the put options in D13, D15, D9, D11, respectively
* User can specify the risk-free rate
* Update the Plot Gap based on your requirement of the payoff profile
In the example, we have considered the stock for Microsoft Corp. (MSFT). The stock price entered by the user is $240 for the short put option and $245 for the long put option. The template uses the Black-Scholes model for options pricing to calculate the expected price of the options at the time of expiry.
Profits and losses
The maximum profit that an investor can realise by playing this strategy occurs when the strike price of the short put at the time of expiration is equal to the underlying asset’s stock price. The profit equals the price of the long put minus the net cost of the diagonal spread. The question arises as to why this is the point of maximum profit. At this point, the long put’s price differs the most from the price of the expiring short put. Thus, the maximum profit from playing this strategy cannot be predicted because it depends on the long put price, which in itself is subject to the level of volatility in the market.
In a long diagonal with puts, losses can occur on either side of the strike price. The maximum risk associated with this strategy is the net cost of the spread(including commissions). If the stock price at the time of expiration rises sharply above the long put’s underlying strike price, then the diagonal spread’s net value tends to zero, and the entire amount paid for the spread is lost. However, the risk involved is less than that of a naked call option.
Breakeven points
The long diagonal strategy with puts option has one breakeven point, which lies above the strike price of the short put. Since this is a dynamic trading strategy with many possible scenarios, it is impossible to calculate the exact breakeven point. The breakeven point of the short put at expiration is the stock price at which the price of the long put equals the net cost of the diagonal spread.
Understanding the market forecast:
Changes in stock price
Short puts have a positive delta, and long puts have a negative delta. When the long diagonal position is established, the net delta is negative. With changes in stock price, the net delta can vary anywhere between -0.90 to slightly positive values. If the stock price is equal to the strike price of the short put at expiration, then the net delta approaches -0.90. If the stock price is below the strike price at the time of expiration, then the net delta is slightly positive. If the stock price rises sharply over the strike price, then the delta of the position approaches zero.
Change in volatility
Long options rise in price and make money as volatility increases, so they have a positive vega. In contrast, short options rise in price and lose money when volatility increases, so they have a negative vega. A long diagonal spread with puts has a net positive vega when the option is first established. The spread’s vega is the highest when the stock price at expiration equals the strike price of the long put, and the vega is the lowest when the stock price equals the strike price of the short put. If both the options go far into the money or far out of the money, then the net vega approaches zero.
Impact of time
Long options have a negative theta (lose money from time erosion), while short options have a positive theta (make money from time erosion). The net theta of a long diagonal spread is generally negative when the position is first established. The theta is the most negative when the stock price at expiration is close to the strike price of the long put, and the theta is the least negative when the stock price at expiration is close to the strike price of the short put.
The bottom line
One requires patience to trade using a long diagonal spread with puts. Since this strategy profits from time decay. Attention to detail and trading discipline are also essential because small stock price changes can significantly impact the profits and losses associated with a diagonal spread. The templates provided by MarketXLS are easy to use and can help you track your options with ease.
Disclaimer
None of the content published on marketxls.com constitutes a recommendation that any particular security, portfolio of securities, transaction, or investment strategy is suitable for any specific person. The author is not offering any professional advice of any kind. The reader should consult a professional financial advisor to determine their suitability for any strategies discussed herein. The article is written to help users collect the required information from various sources deemed an authority in their content. The trademarks, if any, are the property of their owners, and no representations are made.
References
Get Market data in Excel easy to use formulas
- Real-time Live Streaming Option Prices & Greeks in your Excel
- Historical (intraday) Options data in your Excel
- All US Stocks and Index options are included
- Real-time Option Order Flow
- Real-time prices and data on underlying stocks and indices
- Works on Windows, MAC or even online
- Implement MarketXLS formulas in your Excel sheets and make them come alive
- Save hours of time, streamline your option trading workflows
- Easy to use with formulas and pre-made templates

I invite you to book a demo with me or my team to save time, enhance your investment research, and streamline your workflows.