Perform Technical Analysis (Template)
Use MarketXLS's ready-to-use template for evaluating stocks based on technical indicators.
What is Technical Analysis?
About the Template
MarketXLS provides a ready-to-use template for evaluating the stock based on technical indicators.
Timeliness means that the stocks which the user enters in our template would be ranked according to their expected performance.
Thus in this template, we have ranked stocks based on the SMA & RSI.
Thus, the primary rationale for using the template would be to assess the trend of the stock by using past price data and other indicators.
How to Use the Template
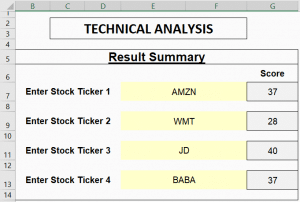
You have to enter Stock Ticker in cells E7, E9, E11, and E13 of this sheet.
Example Stocks
We have taken the following stocks in this example:
- Amazon (NYSE: AMZN)
- Walmart (NYSE: WMT)
- JD.Com (NYSE: JD)
- Alibaba Group (NYSE: BABA)
Automatic Analysis
Detailed Calculations
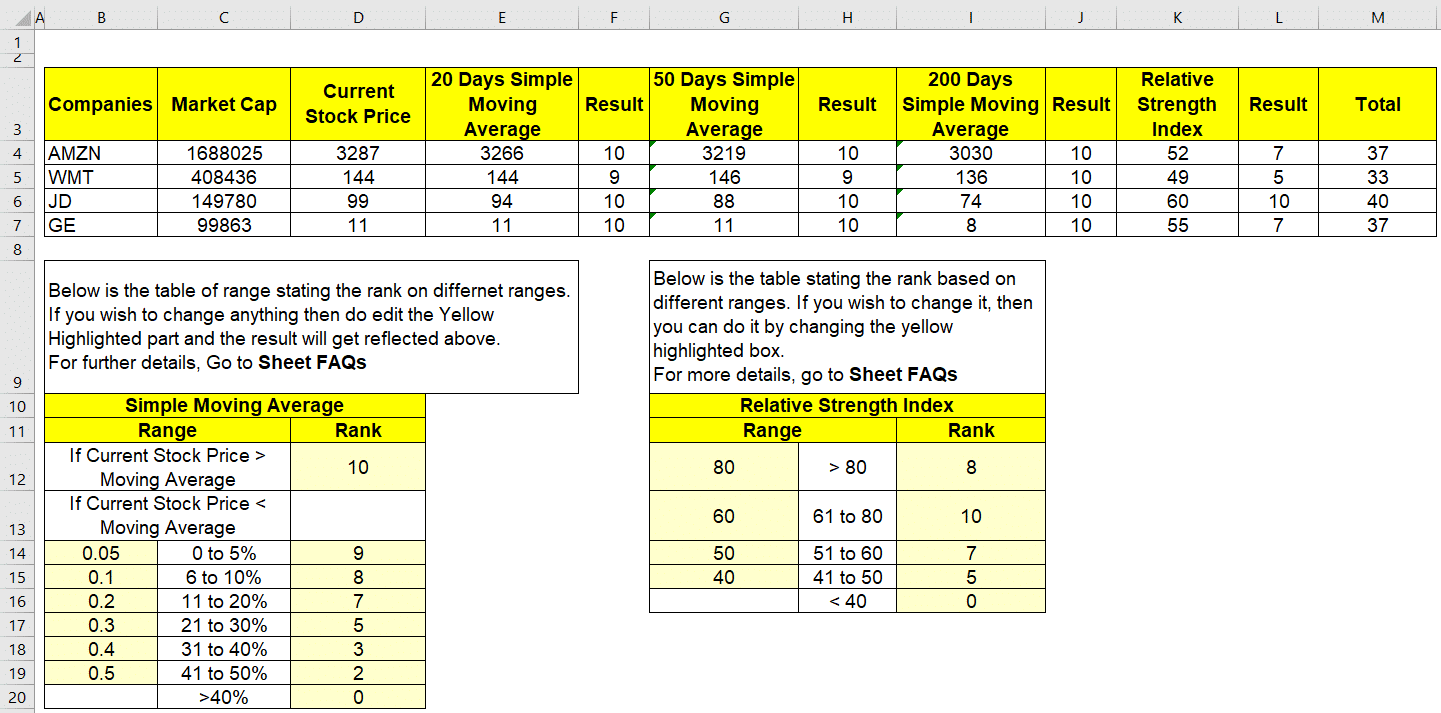
This section of the sheet calculates the score of the stocks based on multiple factors, and the result can be determined based on this score.
Learn More
Additional Resources:
Stock Market Technical Analysis for Beginners