Leverage Ratios – Comparing Companies In Excel Template ( With Marketxls )
")
Meet The Ultimate Excel Solution for Investors
- Live Streaming Prices Prices in your Excel
- All historical (intraday) data in your Excel
- Real time option greeks and analytics in your Excel
- Leading data in Excel service for Investment Managers, RIAs, Asset Managers, Financial Analysts, and Individual Investors.
- Easy to use with formulas and pre-made sheets
A leverage ratio is a financial measurement to check out what proportion of capital comes within in the kind of debt (loans) and assess the ability of a corporation to satisfy its financial obligations. The leverage ratio category is vital because companies rely on a mix of equity and debt to finance their operations, and knowing the quantity of debt held by a corporation is beneficial in evaluating whether it pays off its debts as they come due.
The financial leverage ratios measure the general debt load of a corporation and compare it with the assets or equity. This shows what proportion of the corporate assets belong to the shareholders instead of creditors. When shareholders own a majority of the assets, the corporate is claimed to be less leveraged. When creditors own a majority of the assets, the corporate is considered highly leveraged. All of those measurements are important for investors to know how risky the capital structure of a corporation is and if it’s worth investing in.
Leverage Types
1.) Operating leverage: Operating leverage is a formula that measures the degree to which a firm or project can increase operating income by increasing revenue. A business that generates sales with a higher gross margin and low variable costs has high operating leverage.
Operating leverage= Total contribution / Operating income
2.) Financial leverage: it is also called trading on equity. Financial leverage means the use of preference share capital, equity share capital along with fixed interest bearing securities or debentures i.e. debt. Financial leverage assumes that the firm is capable of earning more on assets than that acquired by use of funds, on which fixed rate of dividend/interest is paid.
Financial leverage= total company debt / shareholder’s equity
3.) Combined leverage: This leverage shows the relationship between alteration in sales and the corresponding variation in taxable income. If the management feels that a certain percentage of change in sales would result in percentage change to taxable income they would like to know the level or degree of change.
Combined leverage= Operating leverage * Financial leverage
How is Leverage Created?
• A corporation takes on debt to buy specific assets. This is referred to as “asset-backed lending” and is very common in real estate and purchases of fixed assets like property, plant, and equipment (PP&E).
• A company borrows money based on the overall creditworthiness of the business. This is usually a type of “cash flow loan” and is generally only available to larger companies.
• When a company borrows money to finance an acquisition (learn more about the mergers and acquisitions process).
• When a private equity firm (or other company) does a leveraged buyout (LBO).
• A business increases its fixed costs to leverage its operations. Fixed costs do not change the capital structure of the business, but they do increase operating leverage which will disproportionately increase/decrease profits relative to sales.
Common leverage ratios
There are several different leverage ratios that may be considered by market analysts, investors, or lenders. Some accounts that are considered to have significant comparability to debt are total assets, total equity, operating expenses, and incomes.
Here is a list of 5 important leverage ratios:
Debt-to-Assets Ratio = Total Debt / Total Assets
The Debt to Asset Ratio, also known as the debt ratio, is a leverage ratio that shows the percentage of assets financed with debt. The higher the ratio, the greater the level of leverage and financial risk.
The debt to asset ratio is commonly used by suppliers to determine the amount of debt in a company, the ability to repay its debt, and whether additional loans will be extended to the company. On the other hand, investors use the ratio to make sure the company is solvent, is able to meet current and future payments, and can generate a return on their invested capital.
Debt-to-Equity Ratio = Total Debt / Total Equity
The Debt to Equity ratio is a leverage ratio that measures the weight of total debt (long term and short term) against total shareholders’ equity. Unlike the debt-assets ratio which uses total assets as a denominator, the D/E Ratio uses total equity. This ratio points out how a company’s capital structure is slanted either towards debt or equity financing.
In short, Debt Equity ratio helps us see the proportion of debt and equity in the capital structure of the company. For example, if a company is too dependent on debt, then the company is too risky to invest in. On the other hand, if a company doesn’t take debt at all, it may lose out on the benefits of leverage.
Debt-to-Capital Ratio = Today Debt / (Total Debt + Total Equity)
This leverage ratio calculation is the extension of the previous ratio. Instead of doing a comparison between debt and equity, this ratio would help us see at entire capital structure. This leverage ratio will help us explain the exact proportion of debt in the capital structure. Through this ratio, we will get to know whether a company has taken a higher risk of supplying its capital with more loans or not.
The debt-to-capital ratio gives analysts and investors an enhanced idea of a company’s financial structure and whether or not the company is a suitable investment. All else being equal, the higher the debt-to-capital ratio, the riskier the company. This is because a higher ratio, the more the company is financed by debt than equity, which means a higher liability to repay the interest and principal payments and a greater risk of defaulting on the loan if the debt cannot be paid timely.
Debt-to-EBITDA Ratio = Total Debt / Earnings Before Interest Taxes Depreciation & Amortization (EBITDA)
Debt/EBITDA—earnings before interest, taxes, depreciation, and amortization—is a ratio showing the amount of income generated and available to pay debt before accounting for interest, taxes, depreciation, and amortization expenses. Debt/EBITDA measures a company’s ability to pay off its funded debt. A high ratio result could indicate a company has quite a heavy debt burden.
This leverage ratio is the ultimate ratio that finds out how much impact debt has on the revenues of a company. And since a company needs to pay interests (cost of debt), this ratio will have a huge impact on the company’s revenues. For example, if the debt is more, the interests would be more (possibly, if the cost of debt is higher) and as a result, the taxes would be less and vice versa.
Asset-to-Equity Ratio = Total Assets / Total Equity
The Assets to Equity Ratio shows the relationship between the Total Assets of the Firm and the portion owned by stakeholders. This is measured using the most recent balance sheet available, whether interim or end of year.
There is no standard Asset to Equity ratio but it is valuable in comparing to similar businesses and industries. A relatively high ratio (indicating more of assets and very little equity) may indicate the company has taken on substantial debt merely to remain in business but a high Asset to Equity ratio can also mean the return on borrowed capital exceeds the cost of that capital.
At some higher levels, however, the ratio can reach unsustainable levels, as the additional debt intensifies up interest costs and the deteriorating financial position puts the firm in difficulty.
How to Find Important Leverage Ratios Using MarketXLS Template?
Step 1: Enter year in the cell C3. Then Enter up to 5 stocks (Ticker symbols) to be compared in the cell range (C5:G5). Here I have taken the stocks of Netflix, Amazon, Visa, Microsoft and Apple each from consumer cyclical, financial and technology sectors for the year 2020. You can also compare stocks from the same sectors to get their respective leverage ratios.
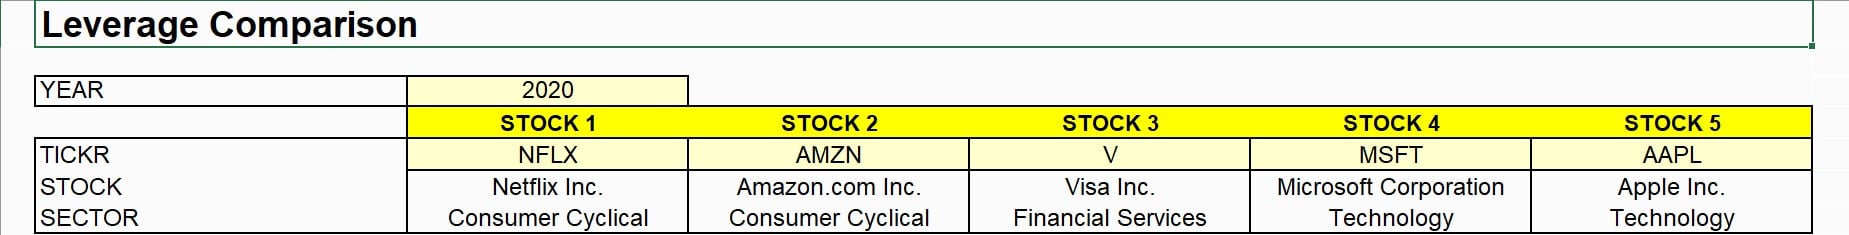
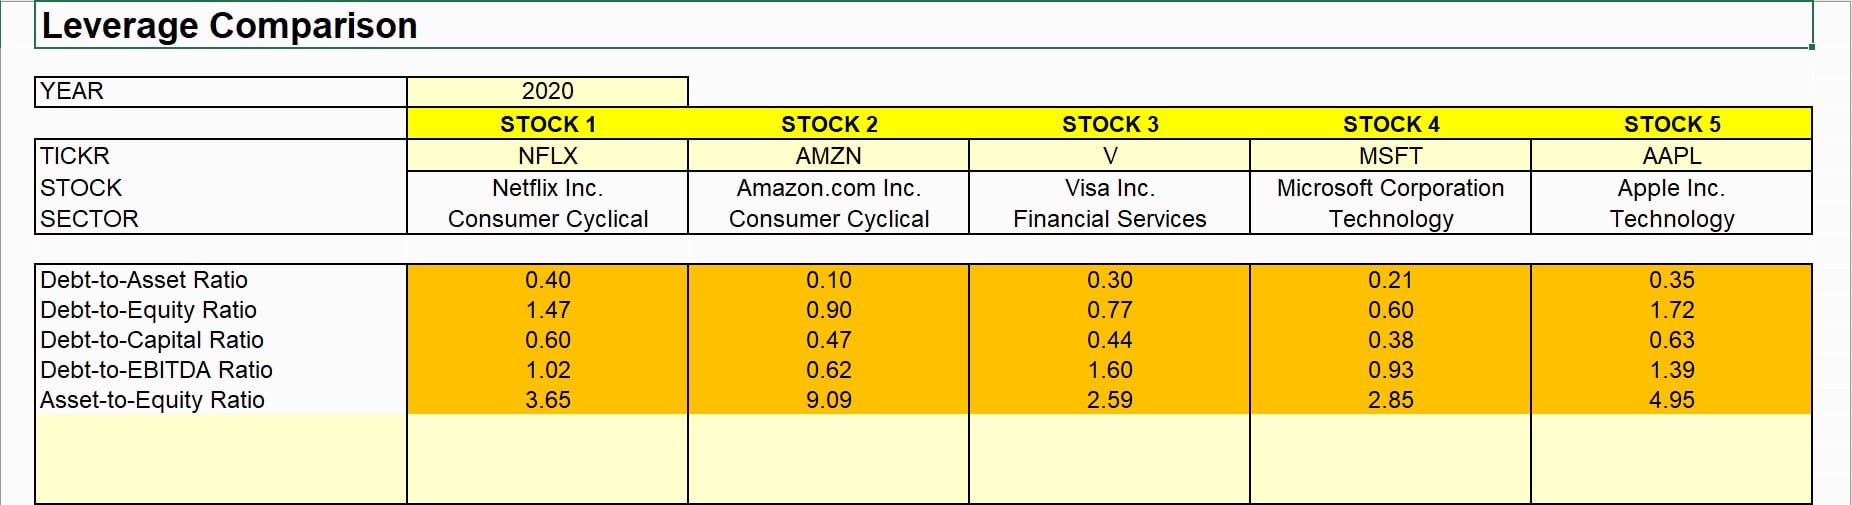
Step 2: As soon as you press enter, stocks’ names and sectors will appear. Further, the calculated important leverage ratios can be seen below it.
Link to this Template: https://marketxls.com/template/leverages-analysis-low-debt-companies-ratio-analysis/
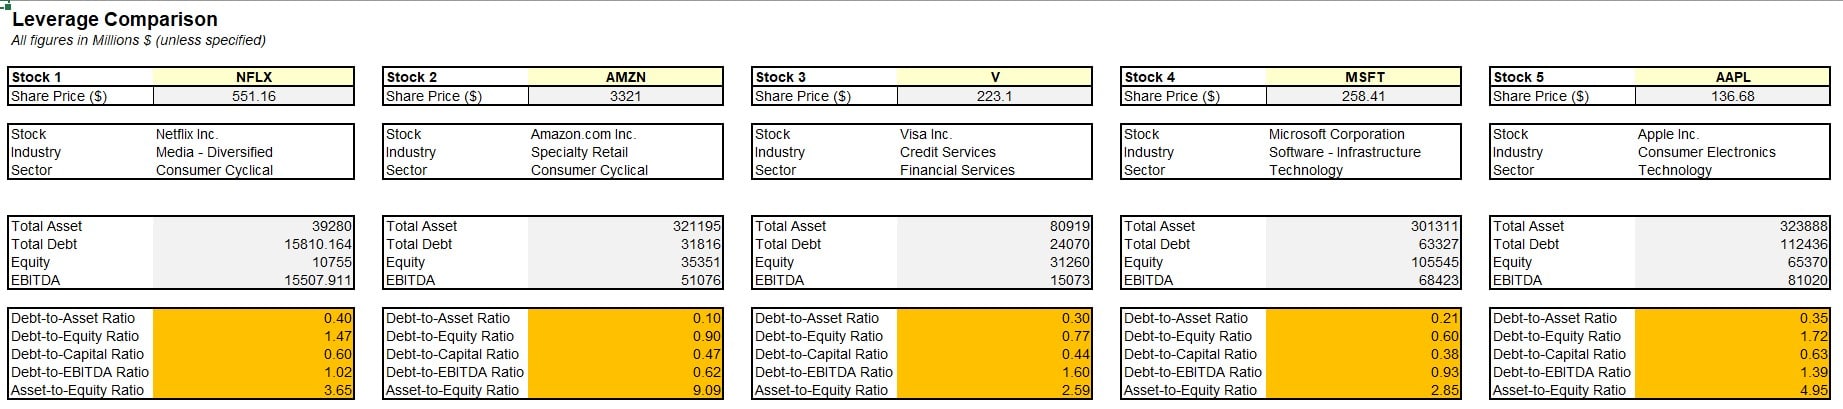
Step 3: To further understand the calculation of leverage ratios, please switch to the CALCULATION sheet. The calculation sheet contains all the related data and information about the company’s earnings, total assets, debt and equity structure. It will appear like this:
With the help of MarketXLS, you can stream market data for stocks, ETFs, options, mutual funds, currencies refreshed, or refresh on-demand. You can also get all the historical data (EOD, Intraday) you may need with MarketXLS functions in a few clicks. Update the Excel tables dynamically and save your time in formatting those tables. Also get access to variety of templates like this and compare your portfolio stocks to get better analysis of your investments.
Risks of High Operating Leverage and High Financial Leverage
If leverage can increase earnings, it can also increase risk. Having both high operating and financial leverage ratios can be quite problematic for a business. A high operating leverage ratio explains that a company is generating few sales, still has high costs or margins that need to be covered. This may either result in a lower profit target or insufficient operating income to cover other expenses and will result in negative earnings for the company. On the other hand, high financial leverage ratios occur when the return on investment (ROI) does not surpass the interest paid on loans. This will significantly decrease the company’s profitability and earnings per share.
Bottom Line
As investors, you need to look at everything. Leverage ratios will help you how a company has structured its capital. Many companies don’t like to take loans from outside. They believe that they should fund all their expansion or new projects through equity.
But to take advantage of leverage, it’s important to structure the capital with a proprotion of the debt. It helps reduce the cost of capital (by reducing the cost of equity, it is huge). Plus, it also helps in paying less tax since the interest payments are tax deductible (i.e. the cost of debt).
If the company has taken too much debt, it’s too risky to invest in the company. At the same time, if a company doesn’t have any debt, it may pay off too much in cost of capital and actually reduce their earnings in the long run.
But only leverage ratios won’t help. You need to look at all the financial statements (especially four – cash flow statement, income statement, balance sheet, and shareholders’ equity statement) and all other ratios to get a concrete idea about how a company is doing. However, it surely does help investors in deciding whether a company is taking advantage of the leverage or not.
Disclaimer
All trademarks referenced are he property of their respective owners. Other trademarks and trade names may be used in this document to refer to either the entity claiming the marks and names or their products. MarketXLS disclaims any proprietary interest in trademarks and trade names other than its own, or affiliation with the trademark owner.
None of the content published on marketxls.com constitutes a recommendation that any particular security, portfolio of securities, transaction, or investment strategy is suitable for any specific person. The author is not offering any professional advice of any kind. The reader should consult a professional financial advisor to determine their suitability for any strategies discussed herein. The article is written for helping users collect the required information from various sources deemed to be an authority in their content. The trademarks if any are the property of their owners and no representations are made.
Reference
www.corporatefinanceinstitute.com
https://www.wallstreetmojo.com/leverage-ratios/
www.investopedia.com
For related articles, click here.

I invite you to book a demo with me or my team to save time, enhance your investment research, and streamline your workflows.