Earnings Power Value Spreadsheet Using Marketxls


While there are many methods to arrive at the intrinsic value of the stock for value investing, one approach is the Earnings Power Value, or EPV. A Columbia University Professor Bruce Greenwald developed this approach. In this article we will learn about the Earnings power Value method to value investing and we will also build an Earnings Power Value Spreadsheet using MarketXLS that you can use to check intrinsic value of any stock.
When it comes to stock markets, there are many approaches to investing and you should choose one that suits your beliefs and style. One such style of investing commonly referred to as value investing is a long-term investing approach where an investor aims to buy stocks that have a low market price compared to the fundamental value that the investor thinks the stock is worth. Since the investor thinks that the market price is lower than its fundamental value, te expects the price of the stock to rise and therefore buys the stock. This perceived difference between market price and intrinsic value of the stock is referred to as margin of safety. Generally, the discount should to be atleast 30-50% for investors interest in the stock.
Earnings Power Value Formula
The formula for Earnings Power Value is based on the assumption that the current earnings of the firm are sustainable under a no growth scenario. EPV estimates the enterprise value by dividing an earnings measure with the weighted average cost of capital.
EPV = Adjusted Earnings / r
r is the cost of capital. We arrive at the adjusted earnings by adjusting the earnings for one time charges, depreciation, capital expenditures, taxation adjustments, and more adjustments based on the business cycle and other details. Finding the adjusted earnings can be difficult.
Let’s look at it in a bit more detail:
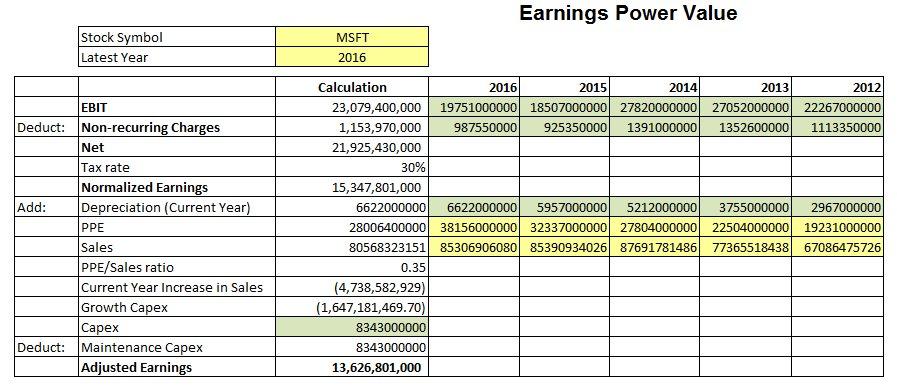
1. Adjusted Operating Earnings
We start with the adjusted operating earnings, i.e., EBIT. We take an average of adjusted operating earnings over the past 5-7 years. This is done to normalize the operating earnings in order to remove the effects of business cycles.
2. Deduct for Non-recurring Charges
We then deduct the long-term average of non-recurring charges from the normalized operating earnings.
3. Taxation Adjustment
We can either use an average tax rate of the company over the 5-7 year period or use the general corporate tax rate and apply it to the figure we get in step 2.
4. Depreciation Adjustment
We now add back the after-tax depreciation of the most recent year as it may not reflect the true economic cost of depreciation. Some analysts may deduct the entire depreciation while other may deduct only a percentage (such as 20%) of the depreciation value.
5. Subtract Maintenance Capital Expenditure
The next step is to deduct the maintenance capex which reflects the economic depreciation. We can calculate this by deducting growth capex from the capex in the cash flow statement. We calculate growth capex by taking an average of Gross Property Plant and Equipment (PPE)/ sales ratio over a long-term period and multiplying this by the current year’s increase in sales.
5. Adjusted After-tax EBIT
We now have the adjusted after-tax EBIT of the firm. We divide this by cost of capital to arrive at the earnings power value of the firm.
After deriving the EPV, we can compare it with the reproduction value. If the EPV is higher than the reproduction value, then the management is adding value and the firm is earning more that it’s cost of capital.
We can also compare EPV per share with the market price. If market price is below EPV per share, then the stock may be undervalued. For a fair comparison, we must first subtract any corporate debt from the EPV, and add back any cash in excess of operating requirements. This number is then divided by the number of shares to arrive at EPV per share.
Note that there are no hard rules for arriving at the EPV or reproduction value. What Greenwald provides is a method along with his recommendations of how to evaluate each item. Each analyst will come up with a different valuation based on their understanding of the financial statements and the business.
Earnings Power Value Spreadsheet (Example)
To demonstrate how we can calculate the Earnings Power Value, we have created a spreadsheet. This spreadsheet showcases the entire calculation using the Microsoft (MSFT) stock. It starts from the operating earnings and then make all the adjustments to calculate the EPV per share of the company. Users need to input some data in cells marked in Yellow. Furthermore, we can fetch some important data using the MarketXLS ‘hf’ functions. We have marked these cells in Green. As you can see in spreadsheet, the EPV per share of Microsoft stock is much lower than its market value. This indicates that the stock is overvalued. Note that EPV is an estimate and can differ based on an analyst’s interpretation of the adjusted earnings and cost of capital.
Buy the EPV Template
These template is open and have no password. Please feel free to modify as per your needs and extend it for your needs
- MarketXLS EPV Template Template
Instant Delivery
Secure Processing
Top 100 Gainers Today
Company Name | Sector | Last Price | Change % from Previous Close | Market Cap | PE Ratio (TTM) | Earning Per Share (TTM) | Fifty Two Week High | Fifty Two Week Low | 7 Day Return | YTD Return | |
---|---|---|---|---|---|---|---|---|---|---|---|
AEY | AEY ADDvantage Technologies Group Inc. | Technology | 1.91 | 35.46% | 19 M | -3.60 | -0.39 | 2.78 | 1.05 | 38.41% | 10.40% |
ADCT | ADCT Adc Therapeutics SA | Manufacturing | 10.30 | 26.85% | 612 M | -3.20 | -2.55 | 32.00 | 5.52 | 27.95% | -49.01% |
AAOI | AAOI Applied Optoelectronics Inc. | Technology | 2.60 | 18.18% | 51 M | -0.90 | -2.22 | 8.86 | 1.48 | 35.42% | -49.42% |
ABVC | ABVC AMERICAN BRIVISION HLDG | Wholesale Trade | 0.67 | 17.54% | 19 M | -0.90 | -0.66 | 11.69 | 0.50 | 13.87% | -80.24% |
AAMC | AAMC Altisource Asset Management Corp Com | Financial Services | 22.56 | 15.87% | 43 M | 10.60 | 2.75 | 31.89 | 8.65 | -11.18% | 43.24% |
AGEN | AGEN Agenus Inc. | Healthcare | 2.97 | 11.24% | 724 M | -20.10 | -0.10 | 6.79 | 1.25 | 13.79% | -7.76% |
ACCD | ACCD Accolade Inc. | Information | 12.91 | 10.06% | 782 M | -1.90 | -6.06 | 49.47 | 4.61 | 9.50% | -51.02% |
ACLS | ACLS Axcelis Technologies Inc. | Technology | 76.87 | 8.80% | 2,258 M | 17.20 | 4.48 | 83.74 | 41.31 | 1.81% | 3.10% |
ACB | ACB Aurora Cannabis Inc | Healthcare | 1.75 | 8.70% | 447 M | -0.40 | -4.61 | 8.69 | 1.21 | 6.06% | -67.65% |
AEHR | AEHR Aehr Test Systems | Technology | 17.76 | 8.09% | 447 M | 43.90 | 0.35 | 27.09 | 5.08 | 18.88% | -26.55% |
ACVA | ACVA ACV Auctions Inc | Wholesale Trade | 9.26 | 7.30% | 1,096 M | -13.70 | -0.58 | 22.82 | 6.10 | 16.77% | -50.85% |
ADGI | ADGI Adagio Therapeutics Inc | Professional, Scientific, and Technical Services | 3.99 | 6.40% | 418 M | -6.70 | -3.07 | 78.82 | 2.41 | 1.53% | -45.04% |
ADMA | ADMA ADMA Biologics Inc | Healthcare | 2.37 | 6.28% | 399 M | -4.30 | -0.50 | 2.48 | 1.01 | 14.49% | 68.09% |
ACST | ACST Acasti Pharma Inc. | Healthcare | 0.96 | 6.11% | 38 M | -5.00 | -0.23 | 3.86 | 0.80 | 9.77% | -24.21% |
AFRM | AFRM Affirm Holdings Inc | Information | 39.19 | 6.00% | 9,332 M | -17.70 | -2.37 | 176.65 | 13.64 | 12.29% | -61.03% |
AADI | AADI Aadi Bioscience Inc | Manufacturing | 13.95 | 5.52% | 295 M | -1.10 | -10.86 | 40.20 | 11.00 | -1.90% | -42.24% |
ACEL | ACEL Accel Entertainment Inc | Arts, Entertainment, and Recreation | 10.45 | 5.34% | 1,058 M | 24.70 | 0.49 | 14.10 | 9.19 | -11.81% | -19.74% |
ADN | ADN Advent Technologies Holdings Inc | Manufacturing | 3.16 | 5.33% | 56 M | -5.20 | -0.56 | 10.04 | 1.13 | 6.40% | -54.92% |
ACIU | ACIU AC Immune SA | Healthcare | 3.41 | 4.92% | 279 M | -3.10 | -1.02 | 12.61 | 2.06 | 7.23% | -31.11% |
AERI | AERI Aerie Pharmaceuticals Inc. | Healthcare | 11.57 | 4.33% | 554 M | -10.30 | -1.05 | 17.21 | 4.81 | 8.54% | 64.81% |
ACAD | ACAD ACADIA Pharmaceuticals Inc. | Healthcare | 16.40 | 4.19% | 2,618 M | -12.50 | -1.33 | 28.06 | 12.24 | -1.32% | -29.73% |
AER | AER Aercap Holdings N.V. | Industrials | 50.46 | 4.13% | 11,271 M | -13.30 | -3.30 | 71.38 | 37.20 | 11.42% | -22.87% |
ADV | ADV Advantage Solutions Inc. | Administrative and Support and Waste Management and Remediation Services | 4.48 | 3.94% | 1,356 M | 19.00 | 0.23 | 9.97 | 3.31 | 3.23% | -44.14% |
ADNT | ADNT Adient plc | Consumer Cyclical | 38.55 | 3.60% | 3,266 M | 4.10 | 8.43 | 50.96 | 27.15 | 12.10% | -19.49% |
ABST | ABST Absolute Software Corp | Information | 10.84 | 3.53% | 509 M | -23.20 | -0.44 | 12.62 | 6.79 | 5.76% | 15.20% |
AEO | AEO American Eagle Outfitters Inc. | Consumer Cyclical | 12.85 | 3.13% | 1,946 M | 7.30 | 2.13 | 34.22 | 10.82 | 1.74% | -49.25% |
AFYA | AFYA Afya Ltd | Educational Services | 12.33 | 3.09% | 1,041 M | 22.40 | 0.53 | 22.80 | 8.73 | 6.66% | -21.51% |
AEM | AEM Agnico Eagle Mines Limited | Basic Materials | 46.26 | 3.03% | 20,478 M | 25.10 | 1.78 | 67.14 | 38.02 | 2.80% | -12.95% |
ABM | ABM ABM Industries Incorporated | Industrials | 47.17 | 3.01% | 2,991 M | 21.00 | 2.16 | 54.00 | 38.08 | 5.53% | 15.47% |
ACR | ACR ACRES Commercial Realty Corp | Finance and Insurance | 9.71 | 2.97% | 83 M | 19.80 | 0.47 | 17.20 | 7.78 | 4.30% | -22.13% |
AG | AG First Majestic Silver Corp. (Canada) | Basic Materials | 8.37 | 2.95% | 2,178 M | -22.40 | -0.38 | 14.67 | 6.31 | -0.59% | -24.66% |
ADM | ADM Archer-Daniels-Midland Company | Consumer Defensive | 86.60 | 2.92% | 46,448 M | 13.00 | 6.37 | 98.88 | 58.44 | 4.98% | 28.13% |
ABIO | ABIO ARCA biopharma Inc. | Healthcare | 2.47 | 2.92% | 35 M | -2.00 | -1.18 | 3.17 | 1.71 | 3.78% | 14.88% |
ADT | ADT ADT Inc. | Industrials | 8.25 | 2.74% | 7,155 M | -266.70 | -0.04 | 10.39 | 6.00 | 3.13% | -1.90% |
ADI | ADI Analog Devices Inc. | Technology | 179.26 | 2.70% | 88,559 M | 53.30 | 3.56 | 191.95 | 138.50 | 1.93% | 1.99% |
ADP | ADP Automatic Data Processing Inc. | Industrials | 256.78 | 2.62% | 103,796 M | 35.50 | 7.03 | 257.16 | 192.26 | 3.29% | 4.14% |
AAP | AAP Advance Auto Parts Inc W/I | Consumer Cyclical | 202.53 | 2.59% | 11,629 M | 21.60 | 9.05 | 244.55 | 164.00 | 4.24% | -15.57% |
AEP | AEP American Electric Power Company Inc. | Utilities | 103.78 | 2.55% | 51,666 M | 19.70 | 5.09 | 104.81 | 80.22 | 3.70% | 16.65% |
ADSK | ADSK Autodesk Inc. | Technology | 233.01 | 2.53% | 47,396 M | 99.90 | 2.23 | 344.39 | 163.20 | 5.58% | -17.13% |
ADBE | ADBE Adobe Inc. | Technology | 445.67 | 2.48% | 199,635 M | 42.40 | 10.31 | 699.54 | 338.00 | 2.61% | -21.41% |
ABNB | ABNB Airbnb Inc. | Administrative and Support and Waste Management and Remediation Services | 124.51 | 2.48% | 68,252 M | 62.60 | 1.99 | 212.58 | 86.71 | 7.50% | -25.21% |
ADTX | ADTX Aditxt Inc | Manufacturing | 0.17 | 2.46% | 9 M | -0.10 | -1.66 | 3.95 | 0.12 | 6.46% | -67.43% |
ABCL | ABCL AbCellera Biologics Inc | Manufacturing | 13.68 | 2.40% | 3,161 M | 18.30 | 0.72 | 22.63 | 5.42 | 16.33% | -4.34% |
AGE | AGE AgeX Therapeutics Inc - Ordinary Shares | 0.69 | 2.39% | 26 M | -2.70 | -0.25 | 1.39 | 0.52 | 0.56% | -37.07% | |
ACCO | ACCO Acco Brands Corporation | Industrials | 6.99 | 2.34% | 632 M | 5.80 | 1.25 | 9.76 | 6.36 | -2.65% | -15.38% |
ACGL | ACGL Arch Capital Group Ltd. | Financial Services | 47.04 | 2.31% | 16,482 M | 10.80 | 4.19 | 50.73 | 37.44 | 6.55% | 5.83% |
AFL | AFL AFLAC Incorporated | Financial Services | 64.03 | 2.22% | 38,180 M | 9.00 | 6.67 | 67.20 | 51.28 | 7.47% | 9.66% |
AES | AES The AES Corporation | Utilities | 24.89 | 2.22% | 15,924 M | -42.60 | -0.53 | 26.52 | 18.62 | 4.27% | 2.43% |
ACM | ACM AECOM | Industrials | 76.57 | 2.16% | 10,279 M | 49.00 | 1.47 | 79.97 | 60.74 | 7.88% | -1.01% |
ACNB | ACNB ACNB Corporation | Financial Services | 36.01 | 2.16% | 298 M | 11.10 | 3.11 | 36.14 | 27.15 | 3.87% | 15.12% |
AAPL | AAPL Apple Inc. | Technology | 172.10 | 2.14% | 2,859,274 M | 27.30 | 6.10 | 182.94 | 129.04 | 4.39% | -3.08% |
ABOS | ABOS Acumen Pharmaceuticals Inc | Professional, Scientific, and Technical Services | 5.40 | 2.08% | 206 M | -586.10 | -2.20 | 19.46 | 3.02 | 2.47% | -20.12% |
ACN | ACN Accenture plc Class A (Ireland) | Technology | 320.44 | 1.91% | 195,957 M | 30.10 | 10.47 | 417.37 | 261.77 | 3.26% | -22.70% |
ADES | ADES Advanced Emissions Solutions Inc. | Industrials | 4.89 | 1.88% | 91 M | 2.00 | 2.39 | 8.00 | 4.41 | 2.52% | -26.13% |
ABC | ABC AmerisourceBergen Corporation | Healthcare | 150.50 | 1.85% | 29,994 M | 16.10 | 8.83 | 167.19 | 113.68 | 7.03% | 13.25% |
ACA | ACA Arcosa Inc. When Issued | Industrials | 64.84 | 1.76% | 2,998 M | 32.90 | 1.90 | 65.33 | 43.42 | 4.80% | 23.04% |
AAL | AAL American Airlines Group Inc. | Industrials | 15.25 | 1.73% | 9,501 M | -5.00 | -2.97 | 22.35 | 11.93 | 1.53% | -15.09% |
ACMR | ACMR ACM Research Inc. | Technology | 19.49 | 1.72% | 1,092 M | 40.20 | 0.55 | 39.71 | 11.23 | 3.23% | -31.43% |
ADPT | ADPT Adeptus Health Inc. | Manufacturing | 12.32 | 1.65% | 1,602 M | -7.10 | -1.64 | 40.00 | 5.96 | 5.39% | -56.09% |
ABCB | ABCB Ameris Bancorp | Financial Services | 49.69 | 1.55% | 3,285 M | 9.80 | 4.84 | 56.64 | 38.22 | 5.32% | 0.02% |
ABTX | ABTX Allegiance Bancshares Inc. | Financial Services | 46.13 | 1.54% | 897 M | 11.90 | 3.73 | 46.14 | 34.39 | 4.46% | 9.29% |
ACOR | ACOR Acorda Therapeutics Inc. | Healthcare | 0.47 | 1.52% | 11 M | -0.10 | -8.79 | 4.99 | 0.28 | 4.60% | -80.42% |
AEMD | AEMD Aethlon Medical Inc. | Technology | 1.36 | 1.49% | 22 M | -2.10 | -0.70 | 5.99 | 0.88 | -5.56% | -26.88% |
AFG | AFG American Financial Group Inc. | Financial Services | 134.77 | 1.49% | 10,878 M | 10.50 | 12.13 | 152.29 | 122.71 | 5.53% | -1.86% |
ACHC | ACHC Acadia Healthcare Company Inc. | Healthcare | 82.61 | 1.47% | 7,230 M | 26.60 | 3.10 | 83.63 | 50.07 | 1.87% | 36.10% |
ABG | ABG Asbury Automotive Group Inc | Consumer Cyclical | 184.81 | 1.46% | 3,940 M | 5.40 | 33.63 | 230.97 | 146.43 | 2.33% | 6.99% |
AEIS | AEIS Advanced Energy Industries Inc. | Technology | 95.00 | 1.40% | 3,374 M | 25.20 | 3.78 | 98.00 | 67.55 | 0.54% | 4.33% |
AAME | AAME Atlantic American Corporation | Financial Services | 3.00 | 1.35% | 59 M | 8.40 | 0.35 | 4.59 | 2.12 | 2.39% | 22.45% |
AFMD | AFMD Affimed N.V. | Healthcare | 3.05 | 1.33% | 484 M | -4.60 | -0.73 | 7.35 | 2.23 | -7.01% | -44.75% |
ADUS | ADUS Addus HomeCare Corporation | Healthcare | 94.41 | 1.31% | 1,502 M | 33.80 | 2.81 | 108.11 | 68.57 | 1.09% | 0.96% |
ADTN | ADTN ADTRAN Inc. | Technology | 24.49 | 1.28% | 1,827 M | -85.20 | -0.28 | 25.29 | 16.30 | 2.64% | 7.27% |
ABR | ABR Arbor Realty Trust | Real Estate | 15.74 | 1.22% | 2,701 M | 7.90 | 2.08 | 20.74 | 12.18 | -1.81% | -14.08% |
ABUS | ABUS Arbutus Biopharma Corporation | Healthcare | 2.50 | 1.21% | 369 M | -4.20 | -0.60 | 6.50 | 1.93 | 0.00% | -35.73% |
A | A Agilent Technologies Inc. | Healthcare | 133.55 | 1.21% | 38,497 M | 32.00 | 4.19 | 179.57 | 112.52 | 0.78% | -16.35% |
ADS | ADS Alliance Data Systems Corporation | Financial Services | 56.80 | 1.16% | 2,932 M | 3.50 | 106.08 | 53.30 | -15.65% | ||
AAON | AAON AAON Inc. | Basic Materials | 61.72 | 1.10% | 3,176 M | 55.70 | 1.15 | 83.79 | 47.50 | -0.10% | -22.30% |
AAU | AAU Almaden Minerals Ltd. | Basic Materials | 0.24 | 1.08% | 33 M | -10.20 | -0.03 | 0.49 | 0.21 | 1.25% | -18.63% |
AEVA | AEVA Aeva Technologies Inc | Manufacturing | 4.03 | 1.00% | 891 M | -7.60 | -0.59 | 10.75 | 2.47 | -9.64% | -46.69% |
ABMD | ABMD ABIOMED Inc. | Healthcare | 293.59 | 0.91% | 12,807 M | 61.80 | 4.79 | 379.30 | 219.85 | -0.06% | -18.26% |
ABT | ABT Abbott Laboratories | Healthcare | 111.48 | 0.90% | 188,974 M | 22.80 | 4.84 | 142.60 | 101.24 | 2.28% | -20.79% |
ACRE | ACRE Ares Commercial Real Estate Corporation | Real Estate | 13.81 | 0.88% | 736 M | 12.10 | 1.11 | 16.48 | 11.18 | 1.54% | -5.02% |
AEE | AEE Ameren Corporation | Utilities | 94.83 | 0.85% | 24,147 M | 23.60 | 3.92 | 99.20 | 80.27 | 3.20% | 6.54% |
AAT | AAT American Assets Trust Inc. | Real Estate | 30.43 | 0.83% | 1,790 M | 44.90 | 0.67 | 40.83 | 28.38 | 2.77% | -18.92% |
ACTG | ACTG Acacia Research Corporation | Industrials | 4.87 | 0.83% | 222 M | 1.90 | 3.62 | 7.54 | 3.30 | -2.60% | -5.07% |
ACT | ACT AdvisorShares Vice ETF | 26.96 | 0.82% | 4,240 M | 6.40 | 4.06 | 27.00 | 18.76 | 3.93% | 30.43% | |
ADMS | ADMS Adamas Pharmaceuticals Inc. | Healthcare | 8.22 | 0.74% | 376 M | -4.80 | -1.70 | 8.25 | 4.02 | ||
AGCO | AGCO AGCO Corporation | Industrials | 112.70 | 0.61% | 7,949 M | 10.20 | 10.59 | 150.28 | 88.55 | 5.19% | -2.86% |
ADC | ADC Agree Realty Corporation | Real Estate | 78.97 | 0.59% | 6,213 M | 41.00 | 1.89 | 79.98 | 61.62 | 1.94% | 10.66% |
ADIL | ADIL Adial Pharmaceuticals Inc | Healthcare | 0.58 | 0.44% | 15 M | -0.70 | -0.88 | 5.08 | 0.45 | -3.08% | -78.70% |
AEZS | AEZS Aeterna Zentaris Inc. | Healthcare | 4.99 | 0.40% | 24 M | -2.40 | -2.12 | 24.38 | 4.11 | -1.19% | -43.82% |
ABBV | ABBV AbbVie Inc. | Healthcare | 142.60 | 0.37% | 247,976 M | 19.90 | 7.11 | 175.91 | 105.56 | 1.61% | 5.32% |
AAN | AAN Aaron's Inc. | Industrials | 14.60 | 0.34% | 429 M | 8.30 | 1.79 | 31.69 | 11.98 | 0.00% | -40.77% |
ACEV | ACEV ACE Convergence Acquisition Corp | Manufacturing | 10.24 | 0.10% | 143 M | 18.90 | 10.25 | 9.63 | 0.20% | 2.81% | |
AAC | AAC AAC Holdings Inc. | Healthcare | 9.88 | 0.00% | 1,235 M | 91.80 | 0.11 | 9.90 | 9.66 | 0.00% | 1.44% |
AAIC | AAIC Arlington Asset Investment Corp | Finance and Insurance | 3.39 | 0.00% | 100 M | -11.00 | -0.29 | 4.04 | 2.88 | 2.73% | -3.14% |
ACC | ACC American Campus Communities Inc | Real Estate | 65.42 | 0.00% | 9,125 M | 130.70 | 0.51 | 65.46 | 48.01 | 0.08% | 14.19% |
ACIW | ACIW ACI Worldwide Inc. | Technology | 26.13 | 0.00% | 2,949 M | 19.90 | 1.31 | 36.01 | 23.63 | 0.81% | -24.70% |
ACRS | ACRS Aclaris Therapeutics Inc. | Healthcare | 16.80 | 0.00% | 1,177 M | -13.40 | -1.34 | 19.97 | 9.26 | -6.67% | 15.54% |
AESE | AESE Allied Esports Entertainment Inc | Arts, Entertainment, and Recreation | 1.57 | 0.00% | 61 M | 1.00 | 1.56 | 2.50 | 1.20 | 1.30% | -8.19% |
AFIB | AFIB Acutus Medical Inc. | Manufacturing | 1.66 | 0.00% | 43 M | -0.30 | -4.50 | 13.80 | 0.48 | 7.79% | -51.32% |
Top 100 losers Today
Company Name | Sector | Last Price | Change % from Previous Close | Market Cap | PE Ratio (TTM) | Earning Per Share (TTM) | Fifty Two Week High | Fifty Two Week Low | 7 Day Return | YTD Return | |
---|---|---|---|---|---|---|---|---|---|---|---|
APTX | APTX Aptinyx Inc. | Healthcare | 0.41 | -32.33% | 38 M | -0.50 | -1.15 | 3.76 | 0.36 | -31.31% | -84.79% |
APYX | APYX Apyx Medical Corporation | Healthcare | 8.25 | -19.75% | 352 M | -22.40 | -0.47 | 17.50 | 3.01 | -21.65% | -35.65% |
APDN | APDN Applied DNA Sciences Inc | Industrials | 3.70 | -18.14% | 45 M | -2.50 | -1.94 | 7.35 | 0.62 | -24.02% | -7.96% |
ANEB | ANEB Anebulo Pharmaceuticals Inc | Manufacturing | 3.85 | -15.01% | 99 M | -1.60 | -1.79 | 7.89 | 2.67 | -7.23% | -37.40% |
ACRX | ACRX AcelRx Pharmaceuticals Inc. | Healthcare | 0.27 | -13.63% | 34 M | -0.90 | -0.27 | 1.19 | 0.16 | 12.78% | -51.80% |
AGRX | AGRX Agile Therapeutics Inc. | Healthcare | 0.57 | -11.93% | 21 M | 0.00 | -26.98 | 50.40 | 0.49 | -7.38% | -97.11% |
AUID | AUID Ipsidy Inc | Manufacturing | 2.51 | -11.31% | 76 M | -3.20 | -0.92 | 18.64 | 1.45 | -15.49% | -82.11% |
ATHX | ATHX Athersys Inc. | Healthcare | 0.26 | -9.30% | 73 M | -0.90 | -0.35 | 1.81 | 0.17 | -14.87% | -71.70% |
AGL | AGL Agilon Health Inc | Manufacturing | 23.39 | -9.17% | 10,828 M | -101.30 | -0.28 | 38.47 | 14.36 | -13.59% | -13.37% |
AP | AP Ampco-Pittsburgh Corporation | Industrials | 4.01 | -8.45% | 89 M | -7.90 | -0.58 | 6.67 | 3.06 | -15.76% | -19.80% |
AIHS | AIHS Senmiao Technology Limited | Financial Services | 0.95 | -7.72% | 52 M | -10.90 | -0.17 | 9.13 | 0.84 | -49.97% | -74.31% |
AFI | AFI Armstrong Flooring Inc. | Basic Materials | 0.35 | -7.26% | 6 M | -0.10 | -2.40 | 3.87 | 0.13 | -82.26% | |
ASTR | ASTR Astra Space Inc | Manufacturing | 1.61 | -6.94% | 345 M | 1.50 | -0.90 | 13.58 | 1.19 | 24.81% | -76.77% |
APM | APM Aptorum Group Limited | Healthcare | 1.48 | -5.73% | 52 M | -2.10 | 2.94 | 0.86 | 0.00% | -1.33% | |
AUD | AUD Pimco Australia Bond Index Exch | Information | 0.69 | -5.57% | 86 M | 14.10 | 0.05 | 4.04 | 0.55 | 22.79% | -72.98% |
ADMP | ADMP Adamis Pharmaceuticals Corporation | Healthcare | 0.33 | -5.26% | 56 M | -1.40 | -0.27 | 1.48 | 0.31 | -12.08% | -45.52% |
ALTM | ALTM Kayne Anderson Acquisition Corp. | Energy | 62.35 | -5.11% | 1,013 M | 13.10 | 91.00 | 58.66 | 1.70% | ||
ALNA | ALNA Allena Pharmaceuticals Inc. | Healthcare | 0.12 | -5.02% | 14 M | -0.20 | -0.65 | 1.17 | 0.07 | -11.53% | -79.54% |
ABEO | ABEO Abeona Therapeutics Inc. | Healthcare | 4.43 | -4.94% | 23 M | -0.20 | -20.50 | 34.00 | 3.26 | 10.20% | -47.42% |
AIT | AIT Applied Industrial Technologies Inc. | Industrials | 113.43 | -4.59% | 3,995 M | 17.30 | 6.17 | 121.20 | 80.93 | 8.25% | 10.45% |
ACXP | ACXP Acurx Pharmaceuticals Inc | Professional, Scientific, and Technical Services | 4.35 | -4.10% | 46 M | -2.80 | -1.51 | 5.92 | 2.33 | 1.16% | 0.66% |
AMC | AMC AMC Entertainment Holdings Inc. Class A | Consumer Cyclical | 24.44 | -3.97% | 11,603 M | -15.50 | -1.59 | 52.79 | 9.70 | 2.00% | -10.15% |
APRE | APRE Aperture Health, Inc | Manufacturing | 0.95 | -3.90% | 22 M | -0.60 | -1.65 | 5.67 | 0.62 | -2.99% | -66.90% |
ACHV | ACHV Achieve Life Sciences Inc. | Healthcare | 5.00 | -3.85% | 48 M | -1.30 | -3.80 | 10.09 | 4.78 | 0.32% | -35.73% |
AE | AE Adams Resources & Energy Inc. | Energy | 33.75 | -3.84% | 146 M | 9.60 | 3.52 | 39.89 | 26.26 | 0.81% | 21.37% |
AEHL | AEHL Antelope Enterprise Holdings Ltd | Manufacturing | 1.09 | -3.54% | 7 M | -0.50 | 3.97 | 0.67 | -12.75% | -31.45% | |
ATNX | ATNX Athenex Inc. | Healthcare | 0.52 | -3.33% | 134 M | -0.60 | -1.72 | 3.91 | 0.41 | -52.73% | -61.76% |
ARAV | ARAV Aravive Inc. | Healthcare | 0.90 | -3.22% | 29 M | -0.50 | -2.12 | 4.40 | 0.80 | -10.45% | -59.11% |
ACI | ACI Arch Coal Inc. | Retail Trade | 28.07 | -2.91% | 15,244 M | 9.80 | 3.02 | 37.99 | 25.89 | 0.97% | -7.02% |
ALOT | ALOT AstroNova Inc. | Technology | 11.75 | -2.89% | 86 M | 13.70 | 0.87 | 18.52 | 10.97 | -0.09% | -12.96% |
AINC | AINC Ashford Inc. (Holding Company) | Financial Services | 17.05 | -2.82% | 55 M | -1.80 | -9.31 | 25.99 | 11.72 | -0.55% | 2.40% |
ADVM | ADVM Adverum Biotechnologies Inc. | Healthcare | 1.47 | -2.65% | 147 M | -1.00 | -1.57 | 2.57 | 0.80 | -3.29% | -16.48% |
ASUR | ASUR Asure Software Inc | Technology | 5.60 | -2.61% | 107 M | 51.80 | 0.11 | 9.94 | 5.01 | 8.11% | -28.48% |
ATRI | ATRI Atrion Corporation | Healthcare | 650.90 | -2.22% | 1,143 M | 35.50 | 18.72 | 805.62 | 585.27 | -1.83% | -7.66% |
ARLO | ARLO Arlo Technologies Inc. | Technology | 7.06 | -2.22% | 624 M | -11.60 | -0.64 | 11.79 | 5.52 | -5.11% | -32.70% |
ALRN | ALRN Aileron Therapeutics Inc. | Healthcare | 0.21 | -2.08% | 16 M | -0.70 | -0.29 | 1.27 | 0.13 | 6.05% | -62.34% |
AC | AC Associated Capital Group Inc. | Financial Services | 39.68 | -1.93% | 903 M | -25.60 | -1.59 | 47.50 | 33.69 | -2.36% | -7.72% |
ACET | ACET Aceto Corporation | Healthcare | 15.40 | -1.72% | 338 M | -15.90 | -1.13 | 21.17 | 6.25 | -15.15% | -11.95% |
AJX | AJX Great Ajax Corp. | Real Estate | 10.16 | -1.65% | 234 M | 23.80 | 0.47 | 14.74 | 8.68 | -2.87% | -22.80% |
AGFS | AGFS AgroFresh Solutions Inc. | Basic Materials | 1.84 | -1.60% | 97 M | -2.20 | -0.82 | 2.44 | 1.52 | 0.00% | -7.54% |
AGLE | AGLE Aeglea BioTherapeutics Inc. | Healthcare | 0.49 | -1.58% | 25 M | -0.30 | -1.26 | 8.50 | 0.37 | 15.22% | -89.64% |
APTO | APTO Aptose Biosciences Inc. | Healthcare | 0.82 | -1.57% | 77 M | -1.40 | -0.63 | 3.13 | 0.71 | -4.43% | -39.12% |
AREC | AREC American Resources Corporation | Basic Materials | 2.52 | -1.56% | 165 M | -5.00 | -0.50 | 2.74 | 1.20 | 0.00% | 40.00% |
ASPS | ASPS Altisource Portfolio Solutions S.A. | Industrials | 11.21 | -1.49% | 180 M | 7.40 | 1.58 | 14.58 | 8.07 | -4.60% | -0.09% |
AHPI | AHPI Allied Healthcare Products Inc. | Healthcare | 2.10 | -1.41% | 9 M | -5.40 | -0.47 | 12.15 | 1.55 | -16.67% | -63.92% |
ATY | ATY AcuityAds Holdings Inc | Information | 2.83 | -1.39% | 151 M | 36.70 | 0.07 | 8.69 | 1.65 | 7.60% | -24.73% |
ALKT | ALKT Alkami Technology Inc | Information | 15.66 | -1.39% | 1,376 M | -23.70 | -0.65 | 32.50 | 9.23 | 4.89% | -21.93% |
ALTA | ALTA Alterola Biotech Inc | Industrials | 44.16 | -1.25% | 834 M | 19.00 | 2.36 | 45.22 | 39.11 | ||
ASRV | ASRV AmeriServ Financial Inc. | Financial Services | 3.98 | -1.24% | 67 M | 8.90 | 0.45 | 4.52 | 3.68 | 1.53% | 3.11% |
ACU | ACU Acme United Corporation. | Consumer Defensive | 28.23 | -1.16% | 96 M | 14.20 | 2.26 | 41.96 | 27.22 | -2.04% | -16.23% |
APT | APT Alpha Pro Tech Ltd. | Basic Materials | 4.47 | -1.11% | 58 M | 17.00 | 0.28 | 8.64 | 3.76 | -5.89% | -25.13% |
ATLC | ATLC Atlanticus Holdings Corporation | Financial Services | 37.33 | -1.09% | 573 M | 5.30 | 10.32 | 91.98 | 30.58 | -7.02% | -47.66% |
AUBN | AUBN Auburn National Bancorporation Inc. | Financial Services | 28.00 | -1.06% | 94 M | 12.50 | 2.16 | 37.11 | 25.82 | 3.32% | -13.31% |
AEYE | AEYE AudioEye Inc. | Technology | 6.73 | -1.03% | 72 M | -4.70 | -1.34 | 13.48 | 3.10 | 6.66% | -4.13% |
AATC | AATC Autoscope Technologies Corporation | Manufacturing | 4.97 | -1.00% | 27 M | 23.60 | 0.84 | 8.38 | 4.84 | -1.19% | -20.99% |
AA | AA Alcoa Corporation | Basic Materials | 52.76 | -0.96% | 9,065 M | 9.50 | 5.24 | 98.09 | 36.61 | 8.45% | -11.45% |
AUMN | AUMN Golden Minerals Company | Basic Materials | 0.33 | -0.94% | 53 M | 59.50 | 0.01 | 0.63 | 0.29 | -1.92% | -6.41% |
ATXI | ATXI Avenue Therapeutics Inc. | Healthcare | 0.29 | -0.93% | 6 M | -1.00 | -0.30 | 1.85 | 0.20 | -0.34% | -68.17% |
AEL | AEL American Equity Investment Life Holding Company | Financial Services | 42.29 | -0.82% | 3,809 M | 4.90 | 7.46 | 44.49 | 27.12 | 16.69% | 8.66% |
ASC | ASC Ardmore Shipping Corporation | Industrials | 9.60 | -0.72% | 346 M | -291.30 | -0.03 | 9.83 | 3.07 | 9.84% | 184.02% |
ARMP | ARMP Armata Pharmaceuticals Inc. | Healthcare | 4.22 | -0.71% | 152 M | -4.20 | -1.00 | 6.49 | 2.82 | -0.12% | -22.99% |
ATH | ATH Athene Holding Ltd. Class A | Financial Services | 83.33 | -0.69% | 16,217 M | 4.50 | 19.44 | 91.26 | 61.62 | 0.00% | |
ACER | ACER Acer Therapeutics Inc. | Healthcare | 1.47 | -0.67% | 24 M | -1.10 | -1.39 | 3.77 | 1.16 | -4.55% | -35.53% |
ALIM | ALIM Alimera Sciences Inc. | Healthcare | 6.73 | -0.59% | 47 M | -2.80 | -2.49 | 7.92 | 3.94 | -6.29% | 31.19% |
ARR | ARR ARMOUR Residential REIT Inc. | Real Estate | 7.59 | -0.52% | 877 M | -6.20 | -1.25 | 11.18 | 5.57 | -1.81% | -22.63% |
ATHN | ATHN athenahealth Inc. | Technology | 9.59 | -0.52% | 314 M | -41.20 | 10.89 | 8.74 | |||
ATGE | ATGE Adtalem Global Education Inc. | Consumer Defensive | 37.57 | -0.45% | 1,762 M | 6.00 | 6.52 | 40.60 | 19.14 | -2.42% | 27.10% |
ARKR | ARKR Ark Restaurants Corp. | Consumer Cyclical | 21.75 | -0.41% | 75 M | 6.00 | 3.61 | 22.20 | 14.39 | 2.98% | 29.27% |
APA | APA Apache Corporation | Energy | 34.70 | -0.40% | 10,671 M | 3.60 | 8.92 | 51.95 | 15.55 | 7.73% | 29.04% |
ATIP | ATIP ATI Physical Therapy Inc | Manufacturing | 0.95 | -0.38% | 217 M | -0.20 | -5.56 | 4.63 | 0.91 | -18.66% | -71.93% |
AFIN | AFIN American Finance Trust Inc. | Real Estate | 8.23 | -0.36% | 1,003 M | -28.00 | 9.48 | 7.76 | -9.86% | ||
ADXS | ADXS Advaxis Inc. | Healthcare | 3.38 | -0.29% | 6 M | -0.50 | -6.90 | 4.50 | 3.19 | -6.11% | -12.21% |
AMPE | AMPE Ampio Pharmaceuticals Inc. | Healthcare | 0.10 | -0.29% | 22 M | -1.00 | -0.10 | 1.83 | 0.09 | -4.51% | -81.81% |
ANGO | ANGO AngioDynamics Inc. | Healthcare | 24.23 | -0.29% | 914 M | -34.90 | -0.68 | 32.00 | 17.56 | 2.24% | -12.15% |
ABSI | ABSI Absci Corp | Professional, Scientific, and Technical Services | 4.78 | -0.21% | 362 M | -3.70 | -1.41 | 24.51 | 2.93 | 23.51% | -41.71% |
ARVN | ARVN Arvinas Inc. | Healthcare | 54.46 | -0.15% | 2,969 M | -12.50 | -4.46 | 98.67 | 34.90 | -2.45% | -33.70% |
AFBI | AFBI Affinity Bancshares Inc | Finance and Insurance | 14.63 | -0.14% | 97 M | 15.20 | 0.99 | 18.00 | 13.19 | -2.47% | -5.00% |
AR | AR Antero Resources Corporation | Energy | 40.26 | -0.12% | 11,434 M | 12.10 | 3.08 | 48.80 | 10.91 | 11.77% | 130.06% |
ASTC | ASTC Astrotech Corporation | Industrials | 0.48 | -0.10% | 24 M | -8.10 | -0.16 | 1.21 | 0.42 | -1.07% | -29.15% |
AAWW | AAWW Atlas Air Worldwide Holdings | Industrials | 100.09 | -0.10% | 2,845 M | 6.90 | 16.13 | 101.62 | 58.70 | 0.09% | 6.34% |
ACBI | ACBI Atlantic Capital Bancshares Inc. | Financial Services | 32.34 | -0.09% | 647 M | 13.40 | 2.38 | 33.68 | 22.14 | 12.41% | |
ALSN | ALSN Allison Transmission Holdings Inc. | Consumer Cyclical | 38.77 | -0.08% | 3,608 M | 8.20 | 4.63 | 42.00 | 32.55 | 2.24% | 6.66% |
AMED | AMED Amedisys Inc | Healthcare | 122.36 | -0.07% | 3,876 M | 28.70 | 4.30 | 188.88 | 101.61 | -0.71% | -24.41% |
AAC | AAC AAC Holdings Inc. | Healthcare | 9.88 | 0.00% | 1,235 M | 91.80 | 0.11 | 9.90 | 9.66 | 0.00% | 1.44% |
AAIC | AAIC Arlington Asset Investment Corp | Finance and Insurance | 3.39 | 0.00% | 100 M | -11.00 | -0.29 | 4.04 | 2.88 | 2.73% | -3.14% |
ACC | ACC American Campus Communities Inc | Real Estate | 65.42 | 0.00% | 9,125 M | 130.70 | 0.51 | 65.46 | 48.01 | 0.08% | 14.19% |
ACIW | ACIW ACI Worldwide Inc. | Technology | 26.13 | 0.00% | 2,949 M | 19.90 | 1.31 | 36.01 | 23.63 | 0.81% | -24.70% |
ACRS | ACRS Aclaris Therapeutics Inc. | Healthcare | 16.80 | 0.00% | 1,177 M | -13.40 | -1.34 | 19.97 | 9.26 | -6.67% | 15.54% |
AESE | AESE Allied Esports Entertainment Inc | Arts, Entertainment, and Recreation | 1.57 | 0.00% | 61 M | 1.00 | 1.56 | 2.50 | 1.20 | 1.30% | -8.19% |
AFIB | AFIB Acutus Medical Inc. | Manufacturing | 1.66 | 0.00% | 43 M | -0.30 | -4.50 | 13.80 | 0.48 | 7.79% | -51.32% |
AGM.A | AGM.A AGM.A | 110.37 | 0.00% | 1,155 M | 9.60 | 11.21 | 124.37 | 87.50 | 2.95% | -8.02% | |
AKU | AKU Akumin Inc | Health Care and Social Assistance | 0.77 | 0.00% | 60 M | -0.80 | -0.87 | 2.87 | 0.46 | 17.50% | -56.00% |
AMTBB | AMTBB Amerant Bancorp Inc. Class B Common Stock | Financial Services | 28.72 | 0.00% | 1,090 M | 19.40 | 1.48 | 29.05 | 19.50 | ||
AMTI | AMTI Applied Molecular Transport Inc. | Manufacturing | 1.96 | 0.00% | 71 M | -0.50 | -3.49 | 33.28 | 1.71 | 4.26% | -85.98% |
ANAT | ANAT American National Insurance Company | Financial Services | 190.02 | 0.00% | 5,109 M | 8.00 | 23.74 | 195.89 | 187.10 | 0.00% | 0.62% |
ANGN | ANGN Angion Biomedica Corp | Manufacturing | 1.03 | 0.00% | 31 M | -1.00 | -1.01 | 13.66 | 0.98 | -1.90% | -64.48% |
ARDS | ARDS Aridis Pharmaceuticals Inc. | Healthcare | 2.31 | 0.00% | 39 M | -0.70 | -3.79 | 4.34 | 0.88 | 0.87% | -0.86% |
ARNA | ARNA Arena Pharmaceuticals Inc. | Healthcare | 99.99 | 0.00% | 6,165 M | -9.90 | -9.69 | 100.00 | 45.50 | 7.59% | |
ASRT | ASRT Assertio Therapeutics Inc. | Healthcare | 3.80 | 0.00% | 174 M | 52.10 | 0.06 | 4.44 | 0.85 | 4.11% | 74.31% |
ATRS | ATRS Antares Pharma Inc. | Healthcare | 5.59 | 0.00% | 955 M | 25.30 | 0.24 | 5.60 | 3.11 | 0.00% | 56.58% |
Get Access to 1 Billion Usable Market data points IN YOUR EXCEL SHEETS WITH EASY TO USE EXCEL FUNCTIONS
Get started todayStand with Ukraine
As the situation in Ukraine escalates, many of us in MarketXLS are left with emotions too overwhelming to name. If you’d like to show your support, but aren’t sure how to, we want to help make it easier for you to act.
For any amount donated, we’ll extend your MarketXLS subscription for double of the donated amount. Please send proof of your payment to support@marketxls.com to avail the extention
From all of us at MarketXLS, thank you!