Stock Screener: In-Depth Research Of A Stock

Meet The Ultimate Excel Solution for Investors
- Live Streaming Prices Prices in your Excel
- All historical (intraday) data in your Excel
- Real time option greeks and analytics in your Excel
- Leading data in Excel service for Investment Managers, RIAs, Asset Managers, Financial Analysts, and Individual Investors.
- Easy to use with formulas and pre-made sheets
In the previous article, we learnt about how you can use our stock screeners to prioritize and research stocks. In this article we will focus on our first screener ‘In-depth Research of a Stock’ that to conduct research on a shortlisted stock.
This screener is that it brings all the fundamental analysis data for all the stocks under one roof.
Once you have a stock in mind, you can use the screener to look up any fundamental indicator for the stock, compare it with any other indicator for the same stock, and view its 10-year trend. All of this happens in one screen with just a few clicks.
In the following screen, I’ve selected Pfizer, a leading pharmaceutical company in the USA.
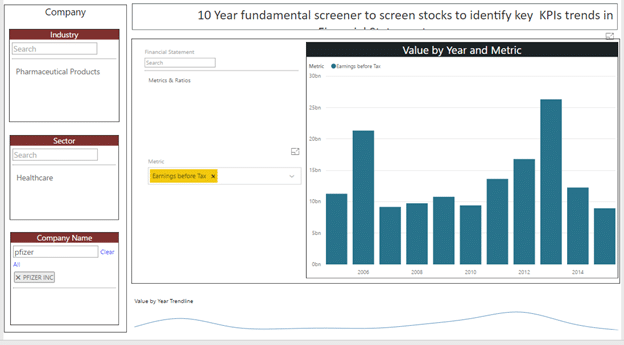
On the screen, you are seeing the 10-year trend for Earnings Before Tax for Pfizer. The screen is very intuitive, make selections and compare metrics.
Let’s first look at how the screen is organized and how to get the maximum value out of it. The screen is divided into three vertical panels
The left panel is for stock selection. If you already have a name of stock with you, just enter that in the Company Name search box and hit enter. You will be presented with a shortlist of stocks matching the name. Select the stock and hit enter. You will immediately observe that the chart in the right panel will change and now showing data only for the selected stock. In the above case,Pfizer.
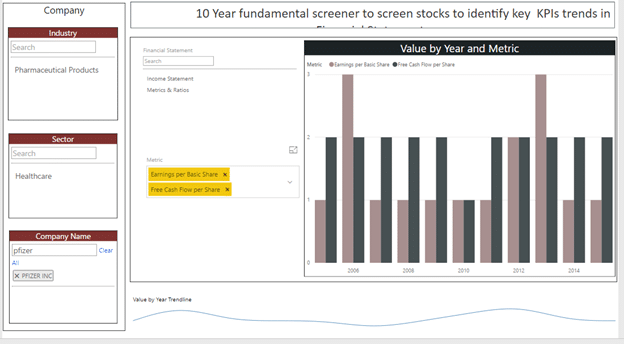
After you’ve selected the stock, you can select the indicators that you want to view from the middle panel.
The indicators are divided into four groups.
Selecting a group will populate the relevant metrics in the Metrics box below. The four groups are:
- Balance Sheet: This includes all balance sheet items such as current assets, current liabilities, total debt, shareholder’s equity, and so on.
- Income Statement: This includes all income statement items such as revenue, gross profit, expenses, income tax expense, etc.
- Cash Flow: This includes all cash flow items such as net cash flow from financing, investing, and operations.
- Metrics and Ratios: This group contains all the calculated items such as Debt/Equity ratio, book value per share, free cash flow per share and many other financial ratios.
You are free to select a metric directly by searching in the Metric selection box. Alternatively, you can first filter them by a particular financial group, such as balance sheet, and then select the metrics related to that. Based on your company and metric selection, the metrics are plotted on the chart in the right side panel.
In the following screen, I’ve selected two metrics related to Pfizer,i.e., Earnings per Share and Free Cash Flow per Share, which provide good indication of the earnings capacity and free cash generated.
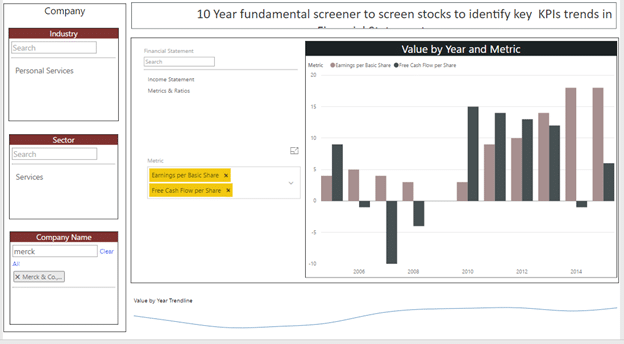
The screener follows the associative model, that is, all data points are associated with each other. So, while researching and filtering, you don’t have to follow a set path, which you generally see in traditional screeners. To give you an example, in the above example, I first selected the Pfizer stock, and then I selected two metrics from the Metrics selection filter. Now let’s say I wanted to see the same two metrics for another stock in mind. In a standard screener, you would have to clear all your filters and start from the beginning to arrive at the same results. However, in MarketXLS, since the data is associated, you don’t have to do that. All you need to do is leave the metric selection as it is. And just select a different company from the company selection box.
This approach makes the screener really powerful and reduces the time required to conduct your research. In the following screen, I started with where I was with my Pfizer stock, and just changed the company to Merck & Co, and now I see the same selected metrics and charts for Merck.
The MarketXLS screener has over 150 fundamental indicators that you can use to perform your research.
The screener is designed with flexibility in mind so you can use it to conduct research as your like. However, with this flexibility, you will need to be careful about a few things to ensure that you are looking at the data accurately. Here are a few points to keep in mind:
- The screener allows you to select any number of stocks at a time. If you select more than one, the screener will add up the values for each metric for all the selected stocks. This way, you get the accurate picture when you have selected only one. We have another screener that you can use when you want to compare metrics among several stocks.
- While selecting metrics to compare, you can select one or many metrics at a time, and all the selected metrics will be plotted on the chart. If you want to select ratios, it’s a good idea to select only ratios. If you’re selecting dollar figures, it would be good to select all dollar figures in one screens. For example, you can select Earnings per Share and Free Cash Flow per Share. If you mix the selections, you may not see desired results. For example, revenue may be $100 million, but price to book value ratio may be something like 1.5 or 2. So, plotting revenue and price to book value ratio in one screen may not make sense. The good thing is that it is very to change the metrics and see results for your new selections.
With the freedom that MarketXLS allows, this might just be the best research tool in your hand. You can access the screen from right within your excel sheet from the MarketXLS menu bar. So, try your hands at it and tell us what you come up with.

I invite you to book a demo with me or my team to save time, enhance your investment research, and streamline your workflows.