Kirkpatrick Value Screen (Marketxls Template)
")
Meet The Ultimate Excel Solution for Investors
- Live Streaming Prices Prices in your Excel
- All historical (intraday) data in your Excel
- Real time option greeks and analytics in your Excel
- Leading data in Excel service for Investment Managers, RIAs, Asset Managers, Financial Analysts, and Individual Investors.
- Easy to use with formulas and pre-made sheets
 Introduction:
Charles Kirkpatrick is president of technical research publisher Kirkpatrick Co™., which has been producing The Market Strategist™ since 1976. He has written three books, among which are the 2008 publication of Beat the Market: Invest by Knowing What Stocks to Buy and What Stocks to Sell™ won huge acclaim. Kirkpatrick believes that investors face an impossible task in predicting the market or the economy. His approach is to look for fundamental and technical indicators as a signal to buy and sell stocks. Central to this philosophy is a focus on relative strength – the performance of a stock price versus the rest of the market. Beyond that, he looks for value and growth drivers to hone the strategy.
Investment Strategy: When to Buy?
Kirkpatrick’s approach is mechanical – he relies less on what the company says or does and more on ‘relative’ indicators connected to the stock price and fundamental data. He is a strong believer in behavioural biases, so his strategy seeks to strip out potential frailties like investor impatience, lack of discipline and fear of being wrong.
He employs a three-step process called STRACT – setup, trigger, and action – which he uses to react to individual price share price movements. His buy and sell indicators include price-to-sales, reported earnings growth, and share price strength. He also uses charts to help in the buy and sell decision process. Using those factors, he developed three investment models – Growth, Value and Bargain. We will be focusing on the Value Model in this article.
With Value Model, he looks for stocks in the top 10% of the market for relative price strength over the previous 130 days. In addition, he screens for stocks in the top 10% of the market for relative reported earnings growth over the previous four quarters. He also prefers to see a relative price-to-sales ratio that ranks among the lowest 30% of the market.
In this method, Mr. Kirkpatrick tries to buy stocks that have been performing well and have bright futures, but currently it is valued a little less. It is a sort of value investing.
When to Sell?
In Value, the sell drivers are when the relative price strength rank falls to below 30% in the market or when the relative reported earnings growth rank drops below 50% against the market. Kirkpatrick didn’t use the price-to-sales ratio as a sell indicator in this model.
Does it Work?
In Beat the Market (2008)™, Kirkpatrick claimed that his stock-picking technique based on the relative strength of prices had outperformed the S&P 500’s performance by an impressive 7.7x over 25 years.
Criteria While Investing:
There are multiple criteria Charles Kirkpatrick applied to filter out stocks:
1. Market Capitalization needs to be greater than $500 Million
2. Price to Sales ratio less than equal to 2.5
3. Relative Strength needs to be higher than 40
4. Share Price needs to be higher than $10
5. Earnings have been growing at more than 15% in the last 3 to 5 years.
Using Kirkpatrick Value Screener ( with MarketXLS template ):
Step 1: The Investor needs to enter the Stock tickers in the Index Sheet to check whether the stock can pass the criteria or not.
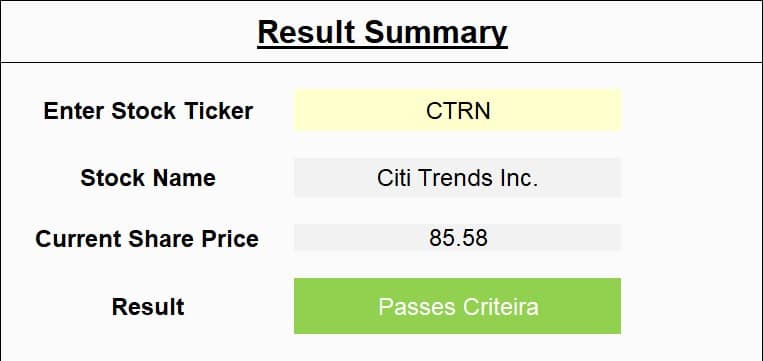 CTRN STOCK” width=”300″ height=”142″ />
Step 2: Then, he can go to the calculation sheet to examine the criteria being met by the conditions or not.
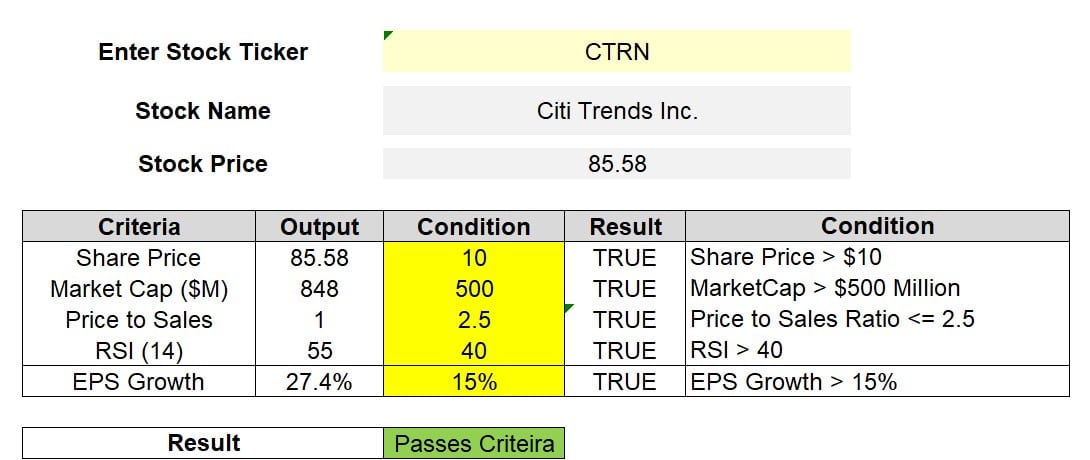 CTRN calculation” width=”300″ height=”127″ />
Step 3: The investor can also go to the calculation sheet and change the conditions as per their requirements. If they want to pick the stocks whose share price is greater than by putting value in first condition and market capitalization should be greater than by putting the value in second condition.
Similarly, the investor has to put the values in 3rd condition on price to sales ratio and in 4th condition for the Relative Strength Index and in 5th condition for EPS growth.
Here I have taken Citi Trends Inc.’s stock and it passed all the default set conditions.
We will now try one more stock by altering one of the conditions according to our investment requirements.
AMZN.jpg”>
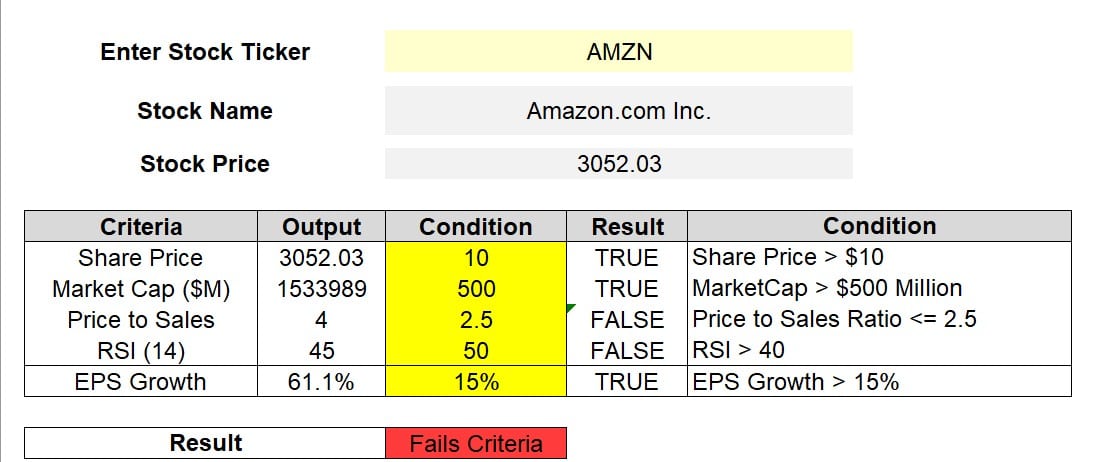 AMZN calculation” width=”300″ height=”126″ />
Now I have taken stock of Amazon as an example. I have also increased the RSI from 40 to 50 according to my investment strategy.
Since Amazon’s stock has a greater price to sales ratio than 2.5 and a lower RSI than 50, it doesn’t pass the criteria. ( Amazon’s stock has only been used as an example. We at MarketXLS neither recommend nor refrain people from buying this or any other stock.)
Disclaimer:
All trademarks referenced are the property of their respective owners. Other trademarks and trade names may be used in this document to refer to either the entity claiming the marks and names or their products. MarketXLS disclaims any proprietary interest in trademarks and trade names other than its own, or affiliation with the trademark owner.
None of the content published on marketxls.com constitutes a recommendation that any particular security, portfolio of securities, transaction, or investment strategy is suitable for any specific person. The author is not offering any professional advice of any kind. The reader should consult a professional financial advisor to determine their suitability for any strategies discussed herein. The article is written to help users collect the required information from various sources deemed an authority in their content. The trademarks, if any, are the property of their owners, and no representations are made.
Reference :
https://www.stockopedia.com/screens/charles-kirkpatrick-value-screen-89/

I invite you to book a demo with me or my team to save time, enhance your investment research, and streamline your workflows.