Synthetic Short Straddle With Puts Option Strategy

Meet The Ultimate Excel Solution for Investors
- Live Streaming Prices Prices in your Excel
- All historical (intraday) data in your Excel
- Real time option greeks and analytics in your Excel
- Leading data in Excel service for Investment Managers, RIAs, Asset Managers, Financial Analysts, and Individual Investors.
- Easy to use with formulas and pre-made sheets
Introduction
Options are an important derivative class, which allow traders to take positions and generate profits with a limited amount of risk. Traders going long on options have to pay a premium whereas those going short / writing the option charge premium. Apart from this there are multiple option trading strategies, which enable traders to further reduce their downside risk and increase the chances of profit making based on different scenarios. These option-trading strategies can prove to be very useful for traders. One of these strategies is the ‘Synthetic Short Straddle With Puts Option Strategy’. We will learn in detail about what the strategy is, when it can be used, what the range of returns are, and how the strategy can be implemented using MarketXLS.
What is Synthetic Short Straddle?
Synthetic Short Straddle is an options trading strategy which is used when the trader expects the market to remain stagnant. Using this strategy, profits can be made even though the market doesn’t move much and remains stagnant. This is the sparkling point of this strategy, which makes it stand out from the other option trading strategies.
How to Execute this Strategy?
A synthetic short straddle with puts can be implemented by:
- Being short on stock
- Simultaneously selling twice as many lots of ATM put options.
Synthetic Short Straddle with Puts Option is used when the investor expects the price movement to be minimum. The aim is to see that the stock moves in a range. The profit here is limited and the maximum loss is unlimited.
Finite Profit Potential
Profit will only occur if the price of the stock stays in the expected range. The maximum profit is limited in this strategy. It can be achieved only when the stock price of the underlying asset is equal to the exercise / strike price of the options sold on the expiration date. The maximum profit would be equal to the net premium received while writing the put options. Both the written put option will expire without any gains/ losses and the net premium will be received by the trader for just writing the put options. The net premium would be the net cash inflow while writing the put options.
Net Premium Received=Premium ×No.of Lots ×Lot Size
Maximum Profit=Net Premium Received
Infinite Loss Potential
The trader executing this strategy would be at the risk of incurring an infinite loss if the market volatility increases. The trader would face losses if the markets move in either direction. The direction does not matter while estimating the losses. The reason behind this is that a huge descent in stock price will cause the uncovered put to expire deep in-the-money, requiring the trader to pay the difference between the price of the stock at expiry and the strike price. Conversely, an upward trajectory in stock price will create an acute loss on the short position, because the trader will need to cover the short.
Concept of Break-Even Points
There is a concept of break-even points in this strategy. There are two break-even points: Upper Break-even Point & Lower Break-even Point.
There will be maximum profit if the options expire at a price, which lies between the range of these breakeven points.
The lower break-even point = Strike Price – (Premium* No.of Lots)
The upper break-even point = Strike Price + (Premium* No.of Lots)
Executing the Strategy Using MarketXLS
MarketXLS is one of the top excel-based investment Research Solutions. It provides ready-to-use templates for facilitating data collection and presentation in an effortless manner. There is a template, which has been built specially for the execution of the Synthetic Short Straddle with Puts Option Strategy.
‘Index Sheet’

This sheet gives a quick introduction to the template and explains how to use the template and mentions the inputs which are required to enter by the user in the template. Let us quickly move ahead to the active template sheet of the strategy which gives us a deeper insight into the strategy and how to implement this using MarketXLS.
‘Active Template Sheet’
This sheet is the actual sheet where the execution of the strategy takes place. It contains all the useful information and insights of the template.
The cells in which the user has to enter his inputs have been highlighted in yellow.
You have to enter the following information in the template:
- Stock ticker
- Expiry date of option
- Price at which you sold one lot of stock
- Number of shares shorted
- ATM Strike price
- Number of lots of ATM put option written
In this article, we will have used the example of ‘MSFT – Microsoft’ for better understanding of the strategy execution and implementation.
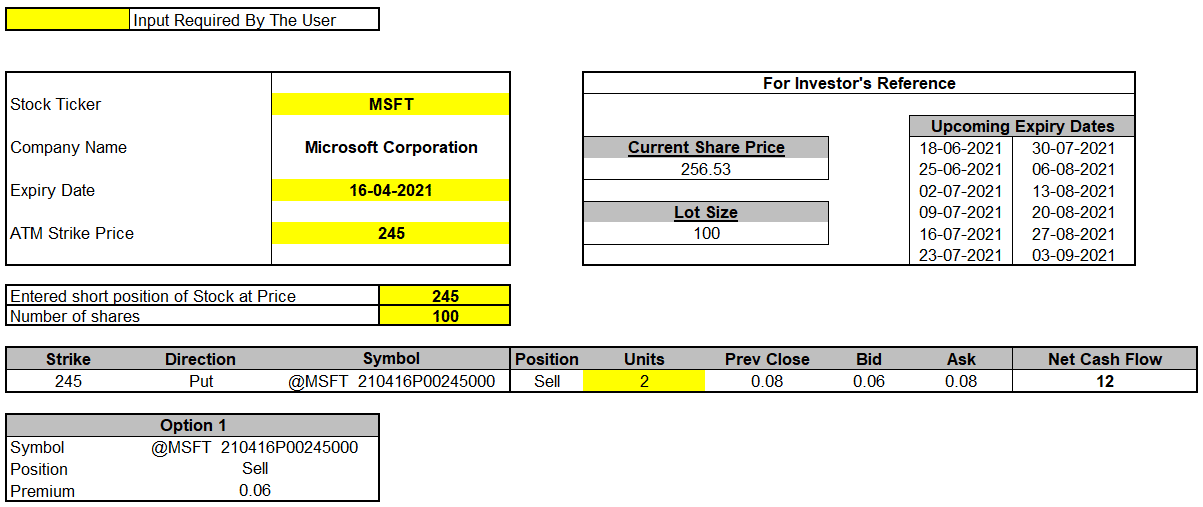
The expiry date of the options contract is 16 April 2021 and the ATM strike price at which the two lots of ATM put options are sold is $245. The number of shares shorted are entered as 100.
Upcoming expiry dates, current share price and lot size are available for investor’s reference on the right.
Now, in order to hedge our position, we will be short on stock and simultaneously sell 2 lots of ATM put options. The net cash flow of premium is always positive for this strategy because the investor is selling the ATM put options. The net cash flow will be an inflow in the form of premiums received.
You can see that the premium received is $0.06, which is equal to the bid price of the options contract. As a result, Net Cash Flow is computed as follows:
Net Cash Flow = Premium received * No.of Lots * Lot Size
= 0.06 * 2 * 100
= $12
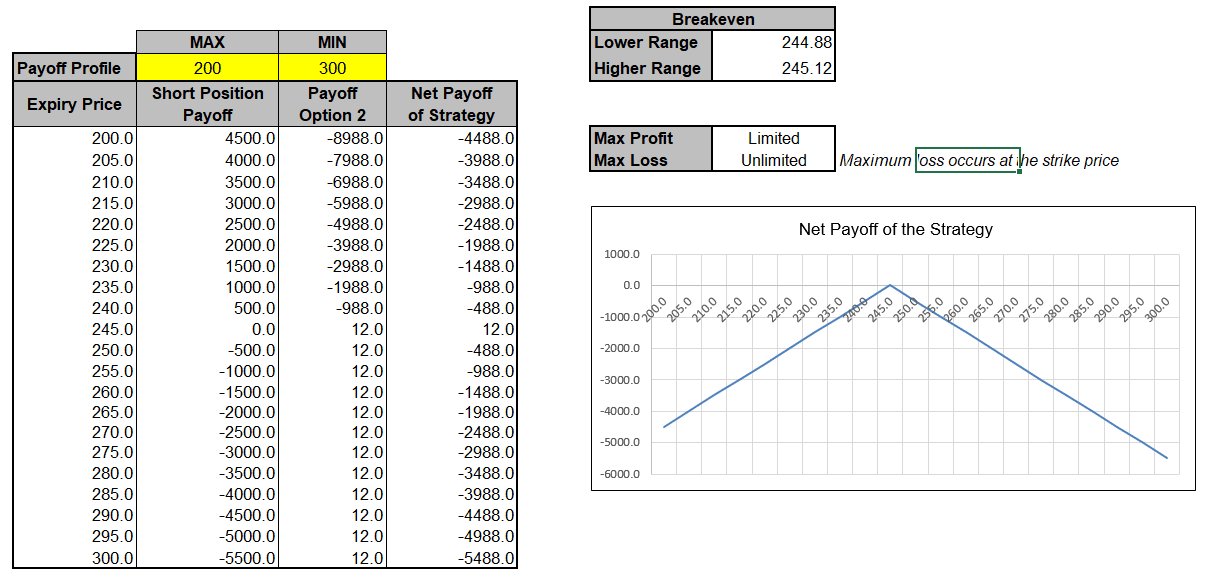
This is the second part of the template. It demonstrates the payoff profile and the chart of the net payoff of the strategy. This is very essential for any trader as it displays the range of expiry prices and demonstrates the profit and loss potential at different expiry levels.
The user has to enter his inputs of minimum and maximum payoff profile. The Net Payoff table, which is on the right side, helps the user observe the potential profit/loss at different expiry levels. The Net Payoff chart is a visual demonstration of the information represented by the table. In the chart, the Y Axis is the Net Payoff of Strategy and the X Axis is the range of expiry prices. Maximum profit occurs at the strike price.
As the expiry prices of the option contract moves farther in either direction, the losses of the trader keeps piling up.
We can see that this strategy earns maximum profits at expiration if the underlying stock expires below the Upper Breakeven Point or above the Lower Breakeven Point.
Conclusion
Synthetic Short Straddle should only be used when the traders expect that the market/ stock will not move significantly over the life of the options contracts.
Many traders avoid using this strategy since there is no limit to the losses if the underlying asset moves significantly in any direction. It is a very risky strategy since there is limited profit potential and unlimited loss potential. Thus, one should use this strategy only if he is assured of a low volatility period of the underlying asset in the near future.
However, this strategy has proved out to be the most effective among its peers when the conditions are favourable for it to work. The profits, though limited, are definite and fixed if the option expires at the strike price itself.
For more such interesting articles on various topics and strategies of the stock market, please visit https://marketxls.com/blog/.
Disclaimer
None of the content published on marketxls.com constitutes a recommendation that any particular security, portfolio of securities, transaction, or investment strategy is suitable for any specific person.
The author is not offering any professional advice of any kind. The reader should consult a professional financial advisor to determine their suitability for any strategies discussed herein.
The article is written to help users collect the required information from various sources deemed to be an authority in their content. The trademarks, if any, are the property of their owners, and no representations are made. All trademarks referenced are the property of their respective owners. Other trademarks and trade names may be used in this document to refer to either the entity claiming the marks and names or their products. MarketXLS disclaims any proprietary interest in trademarks and trade names other than its own or affiliation with the trademark owner.
Reference
https://www.theoptionsguide.com/short-put-synthetic-straddle.aspx
Image Source
https://www.investopedia.com/options-basics-tutorial-4583012
Get Market data in Excel easy to use formulas
- Real-time Live Streaming Option Prices & Greeks in your Excel
- Historical (intraday) Options data in your Excel
- All US Stocks and Index options are included
- Real-time Option Order Flow
- Real-time prices and data on underlying stocks and indices
- Works on Windows, MAC or even online
- Implement MarketXLS formulas in your Excel sheets and make them come alive
- Save hours of time, streamline your option trading workflows
- Easy to use with formulas and pre-made templates

I invite you to book a demo with me or my team to save time, enhance your investment research, and streamline your workflows.