Neff Screen (Filtering Stocks With MarketXLS Template)
")
Meet The Ultimate Excel Solution for Investors
- Live Streaming Prices Prices in your Excel
- All historical (intraday) data in your Excel
- Real time option greeks and analytics in your Excel
- Leading data in Excel service for Investment Managers, RIAs, Asset Managers, Financial Analysts, and Individual Investors.
- Easy to use with formulas and pre-made sheets
Overview
John Neff was a contrarian investor buying good companies with moderate growth and high dividends while out of favour, and selling them once they rose to fair value. John Neff wrote: “If you buy stocks when they are out of favour and unloved, and sell them into strength when other investors recognize their merits, you’ll often go home with handsome gains.” During his tenure as manager of Vanguard’s Windsor Fund between 1964 and 1995, Neff’s average annual total return was 13.7%. He was known as the “professional’s professional” because many fund managers entrusted their money to him.
Neff Screen is a value investing strategy developed on the basis of rules suggested by successful US fund manager John Neff. It combines demanding value criteria with elements of quality, growth, and dividend income. Neff constantly found undervalued stocks in the bargain basement. He liked stocks with a combination of low price-earnings ratios, solid growth forecasts in sales and earnings, and an increasing dividend yield. Neff searched for stocks that were unpopular, and in his words, matching the fund’s “cheapo” profile.

Neff Screen Parameters
Neff’s book, entitled “John Neff on Investing” (John Wiley & Sons, Inc., 2001) discusses his value investing principles. His book served as the main source for this stock screening strategy.
- The Dividend-adjusted PEG ratio is less than or equal to half of the median value for the entire database.
- The estimated growth rate in earnings per share is greater than or equal to 7% and less than or equal to 20%.
- The five-year growth rate in sales is greater than or equal to 7% and less than or equal to 20%.
- Free cash flow per share over the last 12 months and the last fiscal year (Y1) is positive.
- The operating margin over the last 12 months and the last fiscal year is greater than or equal to the industry’s median operating margin over the same period.
The Dividend-Adjusted PEG
With value investing, there are several ways to screen out attractively priced stocks. One way is a combination of criteria that includes a strong dividend yield and a low price-earnings (P/E) ratio with support from solid estimated sales and earnings. The second method is called the dividend-adjusted price-earnings relative to growth (PEG) ratio. However, solid earnings growth forecasts are again needed for this method.
It is calculated by dividing the price-earnings ratio by the sum of the dividend yield and the estimated earnings growth rate and serves as the foundation of this strategy. This ratio encompasses each of the key components used by Neff in his investing style—the price-earnings ratio, earnings growth estimates and the dividend yield.
In order to pass the Neff screen, companies must have a dividend-adjusted PEG ratio that is less than one-half the universal median PEG ratio for the entire stock market.
Growth Rate in EPS
Since low price-earnings ratios alone are not enough, solid earnings growth estimates offer validation to the company. Neff warned that investors must try to evaluate prospects for the company and its industry and look for contradiction or confirmation of the market’s view in the company’s fundamentals. The goal of analysing growth forecasts is to establish credible growth expectations.
Many times, the market reacts negatively if a company reports earnings below the estimate. In this case, when strong fundamentals remain, buying opportunities are created for the low price-earnings investors. Concentrating on long-term, say five-year estimates, Neff required strong growth forecasts, but not so strong that it compromised risk; he, therefore, established an upper limit for any growth forecasts.
The estimated growth rate in earnings per share should be greater than or equal to 7% and less than or equal to 20%.
Growth Rate in Sales
Neff highlights growth in sales as a secondary principle to support a low price-earnings strategy. In terms of important components in a value investing strategy, Neff considered sales growth just after the estimated earnings growth. His argument is that growing sales in turn produce growing earnings. Any measure of margin improvement can support a case for investing, but only attractive stocks are able to justify that by showing considerable sales growth. Therefore, the same parameters for estimated earnings growth are applied for sales growth: Sales growth (over the most recently reported five-year period) should be between 7% and 20%.
Free Cash Flow
Another secondary constituent of Neff’s approach is free cash flow—cash left over after paying capital expenditures. Neff searched for companies that would use this excess cash flow to pay additional dividends, fund acquisitions, repurchase stock shares, or simply reinvest the extra capital back into the firm. The approach requires free cash flow over the latest 12-month period and the most recent fiscal year to be positive.
Operating Margin
The last essential criteria in this screen is to have an operating margin better than current industry medians. Industry medians are used as the benchmark here because margins tend to be very industry-specific. For example, software and programming entities enjoy operating margins in excess of 20%, while grocery stores work on very thin margins. Robust operating margin shields a stock against any negative developments. The Neff approach requires operating margins to be greater than the industry median for both the last 12 months and the most recent fiscal year.
Using The Neff Screen Template with MarketXLS:
MarketXLS software is a one-stop solution for the analysis of your entire investments. It provides a host of functions like eps, various ratios, key fundamentals, historical data, options pricing and much more to assess the value of your investments. It provides a variety of templates for various options trading strategies and Guru screen strategies to compare your portfolio stocks for doing better analysis of your investments.
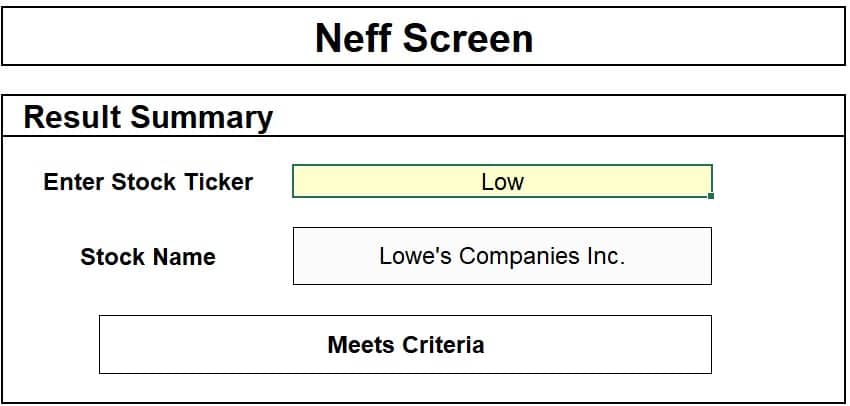
Step 1: Enter the stock ticker in cell E7 and press enter. Move to the active template page of the workbook which will pull out the stock’s name and industry. Here I have taken Lowe’s Companies, Inc. (LOW) stock as an example. This firm operates as a home improvement retailer in the United States and internationally. The company offers a line of products for construction, maintenance, repair, remodeling, and decorating.
Link to the Template: https://marketxls.com/template/neff-screen/
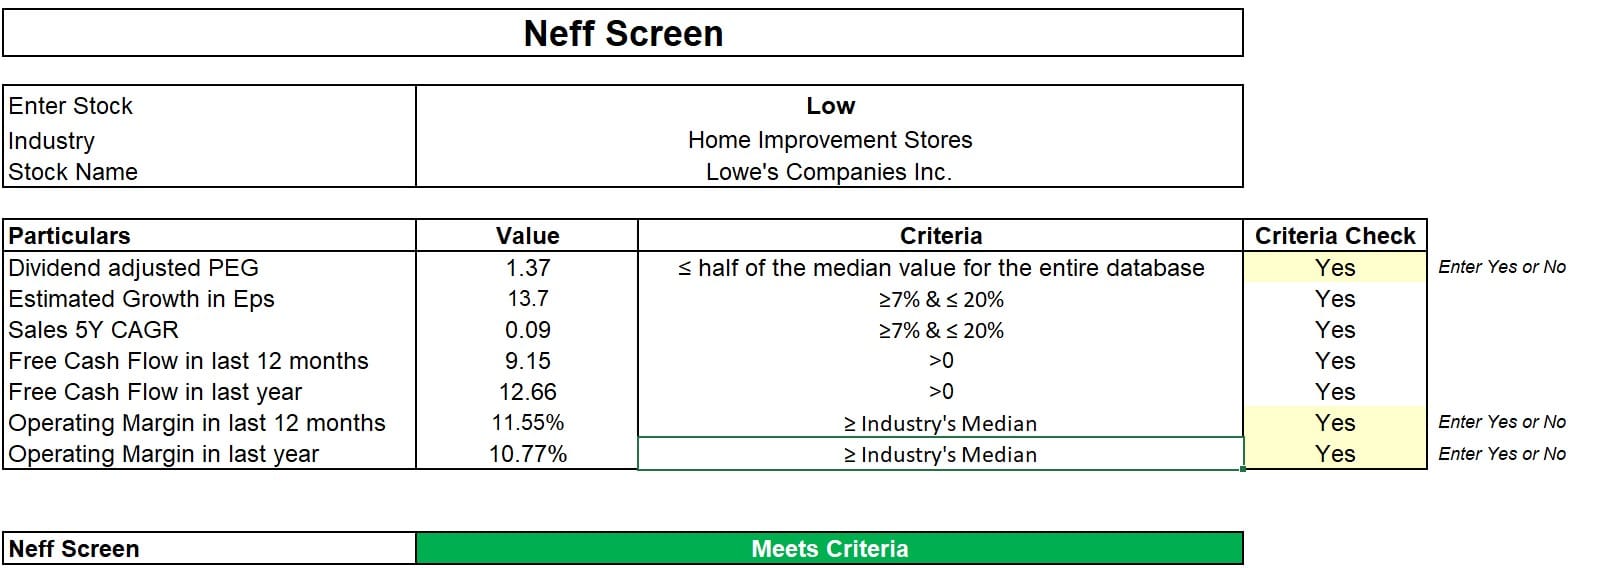
Step 2: The template fetches the quantitative values as specified by Neff and compares these values against the values specified. The user also needs to enter yes or no in the highlighted areas by comparing those values against the specified conditions. As of 8th July, 2021, the Dividend Adjusted PEG of LOW is 1.37 which is less than half the median value of S&P 500 at 1.60.
The operating margin of the last 12 months is 11.55% against the operating margin of the industry at 11.42%.
The operating margin of last fiscal year is also 10.77% which is more than the industry median of 10.75%.
The Dividend Adjusted PEG ratio of S&P 500 and operating margins of various industries can be found easily on popular websites.
Step 3: After entering the data, select Yes or No from the dropdown list accordingly, depending on whether the conditions are met. LOW is meeting all the criteria, so I have selected Yes for all the cells. If a company confirms all the criteria, the result field shows “Meets Criteria” or else “Doesn’t meet criteria”.
Application in Real Life
During his 30-plus years as the manager of the fund, Neff delivered an annual average return that exceeded the rate of return of the S&P 500 index by more than 3%. The fund did have its down years, however, and today value investing is amidst a multi-year period of underperformance.
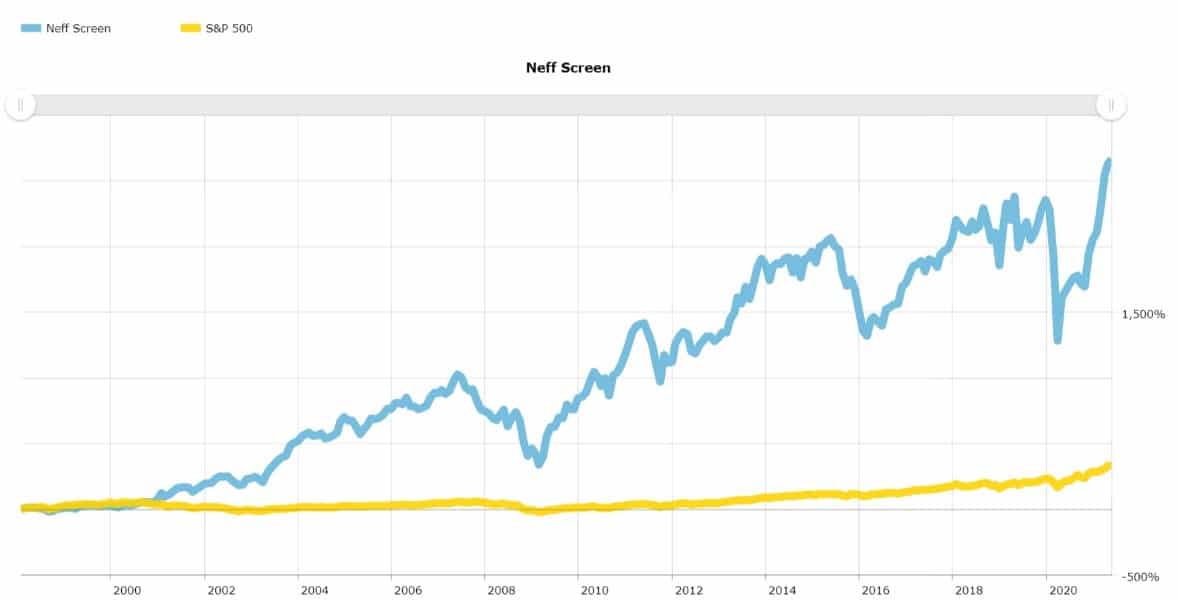
The methodology fell by 5.1% in March and was up 17.7% year to date for 2019. The approach is up 3.4% over the last 12 months. For the past three years, the strategy has given an annual gain of 14.3% (averaged out) and it has an average annual price return of 3.1% over the last five years and 16.6% a year, on average, over the last 10 years. By means of comparison, the S&P 500 has generated an average annual price gain (excluding dividends) of 13.5% over the last 10 years.
To learn more about Guru Strategies and other financial concepts, visit https://marketxls.com/blog
Disclaimer
All trademarks referenced are the property of their respective owners. Other trademarks and trade names may be used in this document to refer to either the entity claiming the marks and names or their products. MarketXLS disclaims any proprietary interest in trademarks and trade names other than its own, or affiliation with the trademark owner.
None of the content published on marketxls.com constitutes a recommendation that any particular security, portfolio of securities, transaction, or investment strategy is suitable for any specific person. The author is not offering any professional advice of any kind. The reader should consult a professional financial advisor to determine their suitability for any strategies discussed herein. The article is written to help users collect the required information from various sources deemed an authority in their content. The trademarks, if any, are the property of their owners, and no representations are made.
Reference
https://www.aaii.com/stockideas/article/10500-john-neff-approach
Image Source
https://www.valueresearchonline.com/stories/46985/the-legacy-of-value-investor-john-neff/

I invite you to book a demo with me or my team to save time, enhance your investment research, and streamline your workflows.