Dividend Safety- Analyzing With Marketxls

Meet The Ultimate Excel Solution for Investors
- Live Streaming Prices Prices in your Excel
- All historical (intraday) data in your Excel
- Real time option greeks and analytics in your Excel
- Leading data in Excel service for Investment Managers, RIAs, Asset Managers, Financial Analysts, and Individual Investors.
- Easy to use with formulas and pre-made sheets
Introduction
Investing in shares that disburse dividends may be a strategic way to create a reliable income stream and build wealth. While investors are absorbing a higher degree of risk, there’s also the potential for greater returns.
Dividends aren’t mandatory payments. Unlike bond coupons, they can be cancelled or lowered. When considering dividend safety, you cannot just check out one year’s worth of EPS and infer whether the dividend is safe or not. you would like to consider several years’ worth of earnings.
Maybe the corporate you are looking at is cyclical and last year’s earnings reflect a robust performance when the outlook for this year may be considerably worse (for example an oil company after a drop in the value of crude)
Furthermore, the earnings could also be impacted by some off events. Positive one-off events that would (temporarily) boost earnings may include the sale of a subsidiary or a tax rebate.
Negative one-off events that would harm earnings may include impairment to assets or a re-structuring of a store or factory.
Type of Investors That Look for Dividends
Generally, the retired people are the ones who wish to get consistent stream of dividends as a source of income generation in the old age. But recently there is a concept of FIRE which is quite prevalent among the youth these days. Financial Independence, Retire Early (FIRE) is a movement dedicated to a program of extreme savings and investment that allows protagonists to retire far earlier than traditional budgets and retirement plans would suggest.
By investing in quality dividend stocks with rising payouts, both young and old investors can benefit from the compounding returns and distribution growth beating inflation. All it takes is a little planning, and then investors can live off their dividend payment streams.
Dividend Paying Sectors
Bigger & established companies with more predictable profits are often the best dividend payers. Companies in the following industry sectors are observed to be maintaining a regular record of dividend payments:
- Utilities
- Healthcare and pharmaceuticals
- Banks and financials
- Oil and gas
- Basic materials
Companies created as master limited partnerships (MLP) and real estate investment trusts (REIT) also are top dividend payers since their designations require specified distributions to shareholders. Start-ups and other high-growth companies, like those within the technology or biotech sectors, might not offer regular dividends. Because these companies may be in the early stages of development and will incur high costs (as well as losses) attributed to research and development, business expansion, and operational activities.
Factors for Dividend Safety Tips
▪ Dividend Payout Ratio
The dividend payout ratio is calculated by dividing a firm’s dividend per share by its earnings per share. This ratio tells you how much profit is being paid out to shareholders in dividends.
Any ratio above 50% is considered a cautionary sign. However, like all ratios, the payout ratio is industry-specific. Some stable industries, such as utilities, have high payout ratios, which is considered normal. Generally, “growth” firms have lower dividend payout ratios because they retain most of their earnings in order to fund future expansion. In contrast, “mature” or more established firms tend to have higher payout ratios as their investment possibilities diminish.
A 100% payout ratio shows that a firm is paying out all of its earnings to its shareholders. Figures above 100% indicate that the payout is greater than earnings, a situation that cannot continue forever; negative ratios show that a company is paying out a dividend while losing money.
▪ Dividend Yield
The dividend yield formula is as follows:
Dividend Yield = Annual Dividend per share / Market value per share
The dividend yield ratio will give you the productivity of your investments. Dividends are also considered as a sign of a stable company since only profit-making companies pay dividends A high or low yield depends on the industry and the company’s business life cycle. The higher the yield, the better the return, but the figures can be delusive.
It is essential to understand that not all companies with a high dividend yield ratio are worth investing. If the share price of the company is falling, the dividend yield ratio becomes more attractive. In such an instance, the stock might not be a good buy. Investors should try to invest in companies that have a dividend yield of more than 10% so that they have a considerable cushion over the risk free return on bank FDs. Investors looking for higher yields also need to do a lot of due diligence about the company’s fundamentals.
▪ Payout Based on Free Cash Flow
Formula: Dividend / Free Cash Flow per share
For investors, there’s no set number listed on a company’s financial statements that States the precise amount of money they might receive for owning the company’s stock. Free income represents the income that’s available to all or any investors before cash is paid out to make debt payments, dividends, or share repurchases.
Free income is usually calculated as a company’s operating income after subtracting any capital purchases. Capital expenditures are funds a corporation uses to purchase, upgrade, and maintain physical assets, including property, buildings, or equipment. In other words, free income helps investors determine how well a corporation generates cash from operations but also what proportion cash is impacted by capital expenditures. Free income are often envisioned as cash left after the financing of projects to take care of or expand the asset base.
Free income may be a measure of monetary performance, almost like earnings, and its use is taken into account to be one among the non-Generally Accepted Accounting Principles (GAAP).
Free Cash Flow v/s Operating Cash Flow
Free cash flow is the cash that a corporation generates from its normal business operations after subtracting any money spent on capital expenditures. Capital expenditures or CAPEX for brief , are purchases of long-term fixed assets, like property, plant, and equipment.
On the opposite hand, operating income is the cash that’s generated from normal business operations or activities. Operating income shows whether a corporation generates enough positive income to run its business and grow its operations.
Operating income is a crucial metric because it shows investors whether or not a corporation has enough funds coming in to pay its bills or operating expenses. In other words, there must be more operating cash inflows than cash outflows for a corporation to be financially viable within the long-term.
Operating income is calculated by taking revenue and subtracting operating expenses for the period. Operating income is recorded on a company’s cash flow statement, which is reported both on a quarterly and annual basis. Operating income indicates whether a corporation can generate enough income to keep up and expand operations. It can also indicate when a corporation might need external financing for capital expansion.
▪ Dividend Coverage Ratio
This ratio shows how secure the dividend is based on the cash flow being generated by the company. This ratio can help you assess how easily the company can keep making its dividend payments. To calculate this ratio, you divide cash flow per share by dividend per share. The higher the dividend coverage from cash flow, the better.
A standard minimum dividend coverage ratio is 1.2, indicating 120% of the dividends are covered by annual cash flow.
▪ Look For Growth Potential
Invest in businesses that have a history of solid growth. If a business has maintained a high rate of growth for several years, they’re likely to still do so. The more a business grows, the more profitable your investment will become. Dividends cannot grow over the long-term without rising earnings.
If a stock you own reduces its dividend, it’s paying you less over time rather than more. This is often the other of what should happen. You need to admit the business has lost its competitive advantage and reinvest the proceeds of the sale into a more stable business. Compare the increase or decrease rate in dividends each time it is declared by the company to be aware about the health of your investments.
▪ Invest In Established Companies
The stock market moves in cycles and it has a tendency to repeat itself now and then. When choosing dividend investments, there’s no better measuring stick than a stock’s past performance. Specifically, investors should be targeting those companies that have earned “dividend aristocrat” status.
These are established companies that have increased their dividend payouts to investors consistently over the previous 25 years. Their brands are easily recognizable, and they generate a steady flow of cash with a high likelihood of continuing to do so in the future. Some companies like Coca-Cola (NYSE:KO), Johnson & Johnson (NYSE:JNJ), McDonald’s (NYSE:MCD), Walmart (NYSE:WMT), W.W. Grainger (NYSE:GWW), etc. have been paying dividends at a growing rate for more than 40 years now. Whereas, stocks like New Residential Investment Corp (NYSE:NRZ), Carnival Corp. (NYSE:CCL) and Delta Airlines (NYSE:DAL) have either reduced or stopped their dividend payments as of year 2021.
▪ Bankruptcy Risk
When a publicly listed company ceases operations and goes into liquidation, the company’s shareholders may be entitled to a portion of the assets, depending on the type of shares they hold. However, the stock itself is usually worthless.
Any company files for bankruptcy because it is in such deep financial trouble that it is unable to pay its immediate obligations.
In case of liquidation, the assets are distributed first to the employees then to the preferential creditors, then to the secured creditors, then to the general unsecured creditors, then to the preference shareholders and finally to the equity shareholders.
Use Altman Z Score Template With MarketXLS To Check For Bankruptcy Risk in a Company:
The Z score was published in 1968 by Edward Altman to gauge company’s financial health. The Model incorporates 5 different ratios which are used to determine the chances of bankruptcy for the firm.
Investors look at the Altman Z score to gauge the possibility of a firm going bankrupt in the near future. This Model is a valuable predictor of financial distress of firms.
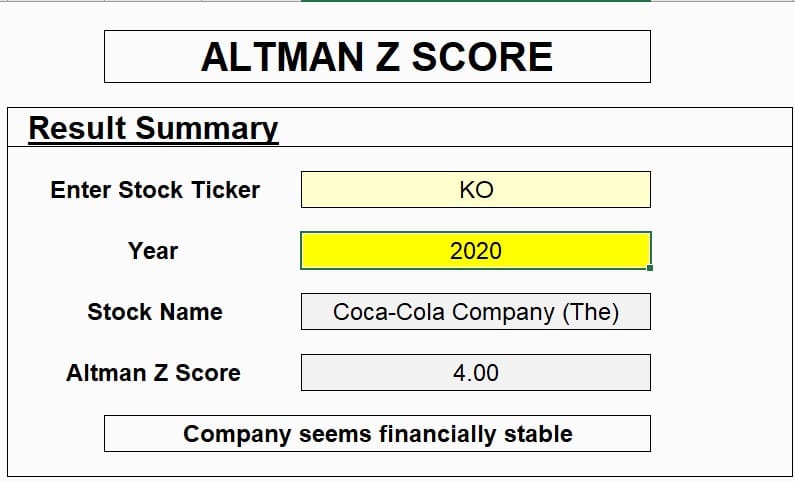
Step 1: Enter the stock ticker in cell E6 and the respective year in cell E8 for calculation of Altman Z Score. Press enter. You will find a score about the company financials and also come to know about its stability. I have used Coca Cola’s stock as an example because it’s a consistently dividend paying company.
Link to this Template: https://marketxls.com/template/altzman-z-score/
Step 2: For detailed analysis, switch to Calculations worksheet. This worksheet contains all the calculated ratios for the company and their factors & weights. Z score is calculated using the five financial ratios and adding their weighted products as per the below formula:
Z score = 1.2A + 1.4B +3.3C + 0.6D + 1*E
where, A : Working Capital / Total Assets
B : Retained Earnings / Total Assets
C : EBIT / Total Assets
D : Market Value of Equity / Total Assets
E : Sales / Total Assets
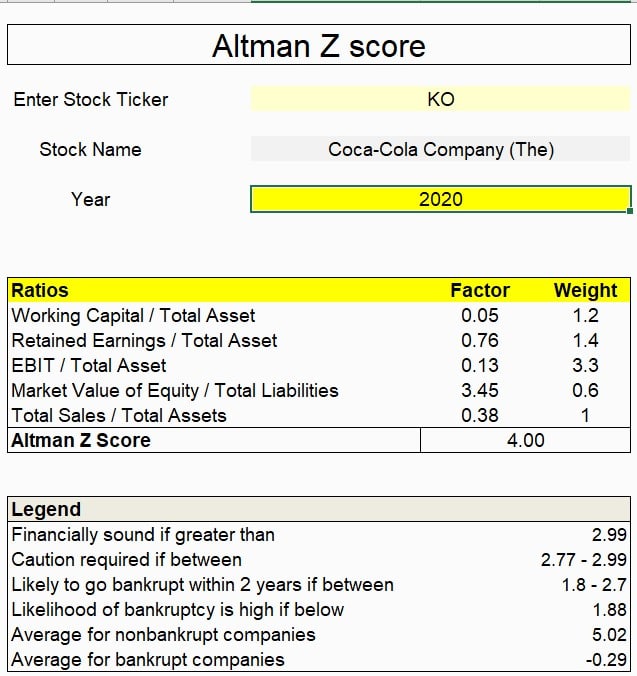
The financial soundness of the firm can be gauged based legend which is present on the calculation sheet. Here the KO stock has got a score of 4 which suggests that company is financially healthy.
Like this you can find plenty of templates to check the financial soundness of a company on MarketXLS website. You can also get loads of features and functions from the software to analyse, compare and enhance your portfolio investments.
Bottom Line
With the proper approach, dividend investing can add an exponential amount of value to an investor’s portfolio. The key lies in knowing how to evaluate stocks and pick those that offer sufficient dividends as per your need along with the strongest returns while minimizing risk and maintaining diversity.
It’s going to be tricky, but by adhering to the tips laid out here, investors may be better able to position themselves for maximum success.
Disclaimer
All trademarks referenced are the property of their respective owners. Other trademarks and trade names may be used in this document to refer to either the entity claiming the marks and names or their products. MarketXLS disclaims any proprietary interest in trademarks and trade names other than its own, or affiliation with the trademark owner.
None of the content published on marketxls.com constitutes a recommendation that any particular security, portfolio of securities, transaction, or investment strategy is suitable for any specific person. The author is not offering any professional advice of any kind. The reader should consult a professional financial advisor to determine their suitability for any strategies discussed herein. The article is written to help users collect the required information from various sources deemed an authority in their content. The trademarks, if any, are the property of their owners, and no representations are made.
Reference
https://www.investopedia.com/articles/investing/122315/6-rules-successful-dividend-investing.asp
https://www.suredividend.com/8-rules-dividend-investing/
Image Source
https://stylesage.co/blog/10-retailers-with-bankruptcy-risk-and-anna-stays-at-vogue/
For more guidance on stock portfolios and templates, click here.

I invite you to book a demo with me or my team to save time, enhance your investment research, and streamline your workflows.