")
What is the open interest?
Let us understand it with the example:
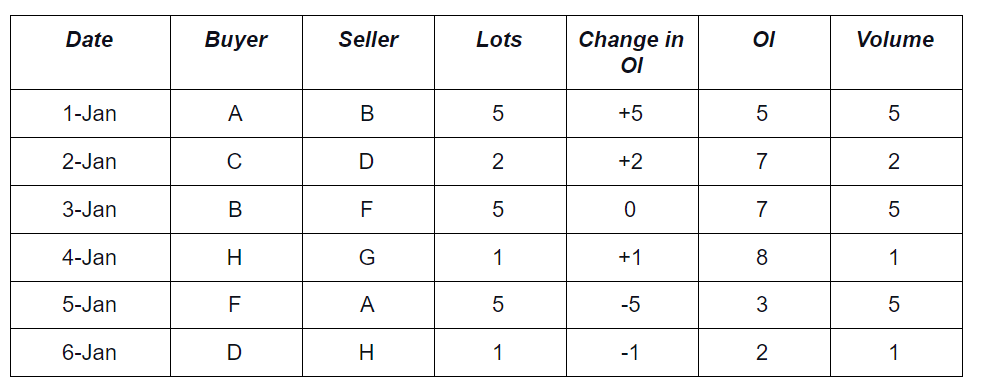
- On 1, 2, 4 Jan, OI increased as new participants entered into the contract.
- On 3 Jan, OI remains unaffected as an existing participant (B) closed his position by merely transferring the contract to a new participant (F).
- On 5, 6 Jan, OI reduced because both the buyer and the seller had closed their existing position.
- Trading volume has increased each day irrespective of the market participants had entered or exited the market.
Analysis of Price & Open Interest-
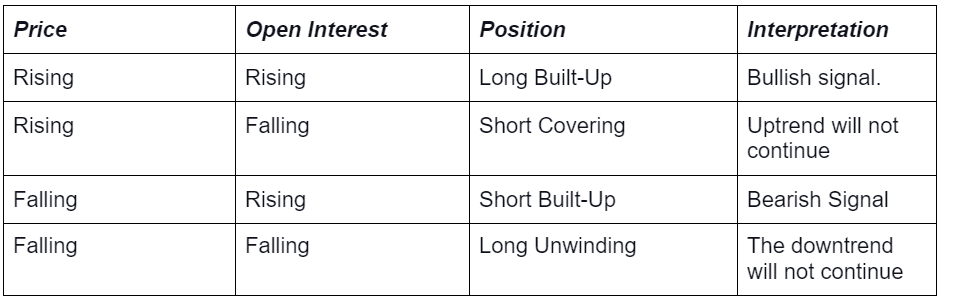
- When price and OI both are increasing, it indicates that long positions are building up. New participants believe that stock will move upward, so they are buying at a higher price. We can interpret, the stock will remain in the uptrend as bullish sentiments are strong.
- When the price is rising while the OI is falling, it indicates that existing market participants are closing their positions. Sellers are covering their short positions. We can assume that the uptrend will not continue.
- When a price is falling while OI is rising, new market participants are entering the market. At a falling price, we can assume that short positions are building up. The market will remain in the downtrend as bearish sentiments are strong.
- When price and OI both are decreasing, it shows that existing players are leaving the market. Here buyers are unwinding their long positions.
Put Call Ratio (PCR)
Put call ratio is the total number of open put contracts divided by the total number of open call contracts. PCR also calculated on the basics of volume. Traders get the signal of correction and reversal in the price movement. Traders analyze PCR and price to predict the trend of the market. When PCR rises, it implies a bullish signal as put writing is more than the call writing. But when PCR decreases, call writers are more active than the put writers. It can be a bearish signal.
Analysis of Put-Call Ratio (OI)
- Investors consider 0.7 as an average PCR as people are trading more calls than puts.
- If a PCR is between 0.7 and 1, it is considered a neutral trend. The market will move sideways.
- If a PCR is above 1.5, it shows that investors are trading more puts than calls. It is called an overbought zone. Some traders consider it as a bearish signal.
- If a PCR is below 0.7, it indicates call writers are more active than the put writers. Some traders interpret it as a bullish signal and expect that the market will start rising. It is considered an oversold zone.
How can traders use open interest?
1. To find the resistance and the support-
Traders can predict the movement of the stock by analyzing open interest. A resistance level sets on the OTM call strike where the number of opened contracts is maximum. A support level fixes on the OTM put strike where the number of open contracts is maximum.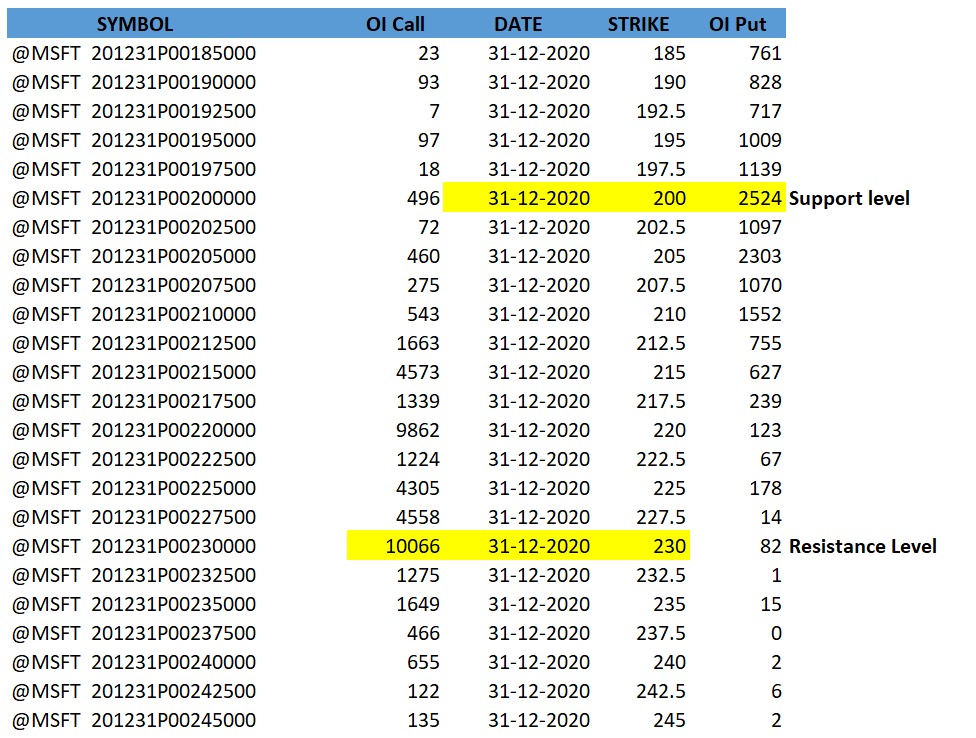
Example:
2. To get the correction and reversal signal-
Traders can predict market sentiments by analyzing the price and OI and accordingly decide their position. PCR (price call ratio) gives the signal of entry and exit. Some traders predict the correction and reversal of the market based on price and PCR.
- If PCR starts increasing during price correction in an up-trending market, it is considered a bullish signal.
- But if PCR decreases during corrections, the trend can reverse and change into bearish.
- If PCR starts increasing during price correction in a down-trending market, it suggests a reversal in the market.
- Similarly, if PCR decreases during price correction downtrend may continue in the market.
MSFT-1.png”>
PCR is rising gradually along with the price indicating a bullish signal. Put writing is increasing indicating that the market will remain on the uptrend.
3. To determine the liquidity of the stock-
Higher OI indicates higher liquidity of the stocks. Dealing in liquid stocks gives the flexibility to enter and exit the market. Traders get information about the most active stocks by examining OI.
Conclusion-
Disclaimer
None of the content published on marketxls.com constitutes a recommendation that any particular security, portfolio of securities, transaction, or investment strategy is suitable for any specific person. The author is not offering any professional advice of any kind. The reader should consult a professional financial advisor to determine their suitability for any strategies discussed herein. The article is written for helping users collect the required information from various sources deemed to be an authority in their content. The trademarks if any are the property of their owners and no representations are made.
Reference
Learn more about options trading here
Learn more about options and various strategies here
Learn more about open interest here
