Portfolio Risk Management (With Marketxls)
")
Meet The Ultimate Excel Solution for Investors
- Live Streaming Prices Prices in your Excel
- All historical (intraday) data in your Excel
- Real time option greeks and analytics in your Excel
- Leading data in Excel service for Investment Managers, RIAs, Asset Managers, Financial Analysts, and Individual Investors.
- Easy to use with formulas and pre-made sheets
From both a mathematical and emotional perspective, large losses have a much larger impact than large gains on the probability that you will achieve your long-term investing goals. Hence, risk management can quickly become a gamble if models are not understood and the complexity of dependencies and their impact on risk is underestimated.
Portfolio risk management does not mean avoiding risky projects entirely to ensure success. It means to have a better understanding of the overall level of risk in a portfolio, and then adjust risks accordingly.
WHAT IS PORTFOLIO RISK MANAGEMENT?
Portfolio risk management involves processes to identify, assess, measure, and manage risk within the portfolio and is focused on events that could negatively impact the accomplishment of strategic objectives.
Effective Risk Management Plan
It is believed that an effective risk management plan has two key elements.
- The first is a portfolio that is well-diversified across broadly defined asset classes, in order to maximize the probability of achieving an investor’s long-term real rate of return target within acceptable shortfall and other constraints.
- The second element of an effective downside risk management plan is an automatic rebalancing strategy that keeps actual portfolio weights close to their long-term targets.
- When an asset class is substantially overvalued, it is far more important to avoid a large loss than to hold out for another month of gains. And when if this asset class declines in price to a level below its reasonable value, an investor focused on achieving long term goals has flexibility in deciding when to reinvest, since from this low base the expected asset class returns will be higher than those assumed in the portfolio analysis that set the long-term asset class weight. To check whether a stock is overvalued or undervalued click here.
Portfolio Risk Management using MarketXLS
Over the last few years, MarketXLS has created a database of several templates including risk management and investment strategies covering how investors can manage risk across technologies. These templates (link) are available here. These templates are designed so that you can better identify and assess different risks and investment strategies and decide how to develop a risk management strategy to ensure the safety of your assets.
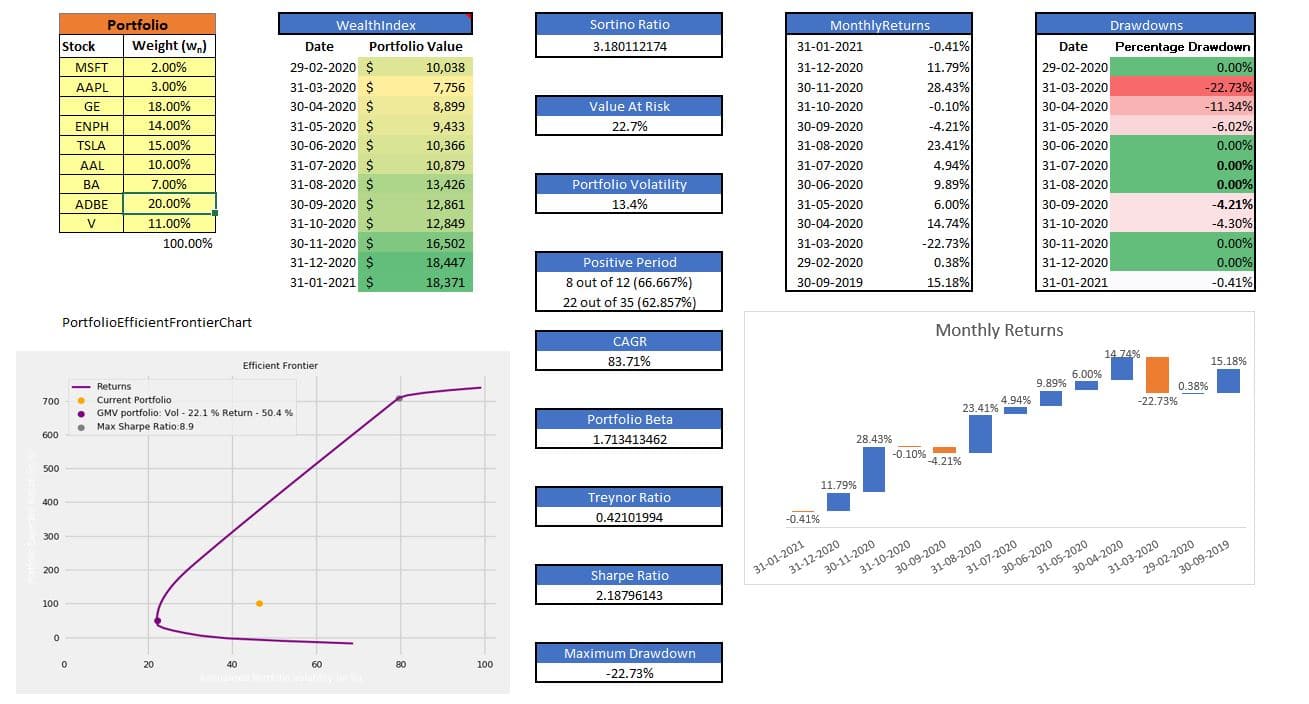
There are several metrics and ratios which can help to manage the portfolio risk. These can be calculated automatically using MarketXLS templates.
- Sharpe ratio – Sharpe ratio is a measure of excess portfolio return over the risk-free rate relative to its standard deviation. A portfolio with a higher Sharpe ratio is considered superior relative to its peers.
- Sortino ratio – Sortino ratio is a variation of the Sharpe ratio that differentiates harmful volatility from total overall volatility by using the asset’s standard deviation of negative portfolio returns instead of the total standard deviation of portfolio returns.
- Treynor ratio – Treynor ratio is a reward-to-volatility ratio. It is used to determine how much excess return was generated for each unit of risk taken on by a portfolio. In contrast to the Sharpe Ratio, which adjusts return with the standard deviation of the portfolio, the Treynor Ratio uses the Portfolio Beta, which is a measure of systematic risk.
- Value at risk – VAR estimates how much a set of investments might lose (with a given probability), given normal market conditions, in a set time period such as a day. Value at Risk gives the probability of losing more than a given amount in a given portfolio.
- Maximum drawdown – Maximum drawdown is an indicator of downside risk over a specified time period. A low maximum drawdown is preferred as this indicates that losses from investment were small.
How to use the MarketXLS Template
- Create your portfolio as done in cells B4 to B12 in the Portfolio Analysis sheet
- The various portfolio ratios will be calculated automatically. The example in this sheet shows a stock portfolio, but any Stock/ ETFs / Crypto can be added to your portfolio. The supported cryptocurrency symbols are in the “All Crypto Symbols” tab
- Sometimes you might have to go over the function cell and press F2 and press enter
- Read the documentation to learn more – https://marketxls.com/blog
- This gives you the power to see your portfolio as large fund managers do!
Disclaimer
None of the content published on marketxls.com constitutes a recommendation that any particular security, portfolio of securities, transaction, or investment strategy is suitable for any specific person. The author is not offering any professional advice of any kind. The reader should consult a professional financial advisor to determine their suitability for any strategies discussed herein.
The article is written to help users collect the required information from various sources deemed an authority in their content. The trademarks, if any, are the property of their owners, and no representations are made.
Conclusion
In sum, effective portfolio risk management is critical to achieving an investor’s long-term real return objective, and the financial goals (not to mention hopes and dreams) that depend on it.
The main objective of portfolio risk management is to reduce the impact of negative events and increase the impact of positive events on a portfolio. Portfolio risk management then requires a balancing act for portfolio managers and everyone concerned, what with portfolio components being dynamic, changing and shifting every time a program and/or a project is improved, delayed, or manipulated to achieve balance and strategic fitness of a portfolio.
Reference
To know more about risk management and the strategies involved click here and here.

I invite you to book a demo with me or my team to save time, enhance your investment research, and streamline your workflows.