Risk Parity Portfolio In Excel – Explanation & Construction

Meet The Ultimate Excel Solution for Investors
- Live Streaming Prices Prices in your Excel
- All historical (intraday) data in your Excel
- Real time option greeks and analytics in your Excel
- Leading data in Excel service for Investment Managers, RIAs, Asset Managers, Financial Analysts, and Individual Investors.
- Easy to use with formulas and pre-made sheets
Risk Parity Portfolio
The risk parity approach to portfolio construction seeks to allocate the capital in a portfolio based on a risk-weighted basis. It attempts to avoid the risks and skews of traditional portfolio diversification.
The basic difference between Risk Parity Portfolio and normal portfolio is that the Risk Parity Portfolio contains diversified class of assets and it makes the usage of correlation to maximize the returns and keep the volatility tolerable. Market XLS will automatically calculate the ratios and metrics which include: Correlation, CAGR, Value at Risk, Portfolio Volatility, Positive Period, Portfolio Beta, Treynor Ratio, Max. Drawdown, Sharpe Ratio and Sortino Ratio.
Correlation
Correlation is a statistical measure of how two asset prices move in relation to each other. Correlation calculations are based on historical data; there is no guarantee that these correlations will continue in the future. MarketXLS has a ready-to-use template, using which you can find correlation between two assets easily. The link for this template is attached with the image given below.
Building a Risk-Parity Portfolio using MarketXLS
1) We have tried to build a Risk-Parity Portfolio using 4 assets (each having a weightage of 25%)
2) We will start by allocating equal weight to all these assets
3) We will use MSFT (stable), TSLA (highly volatile), an ETF and an Inflation Protected bond in our example.
4) For better simulation, we will use the period from March 2020 – February 2021.
5) A basic Investment of 7,000 USD has been taken.
Let us dive straight into the construction!
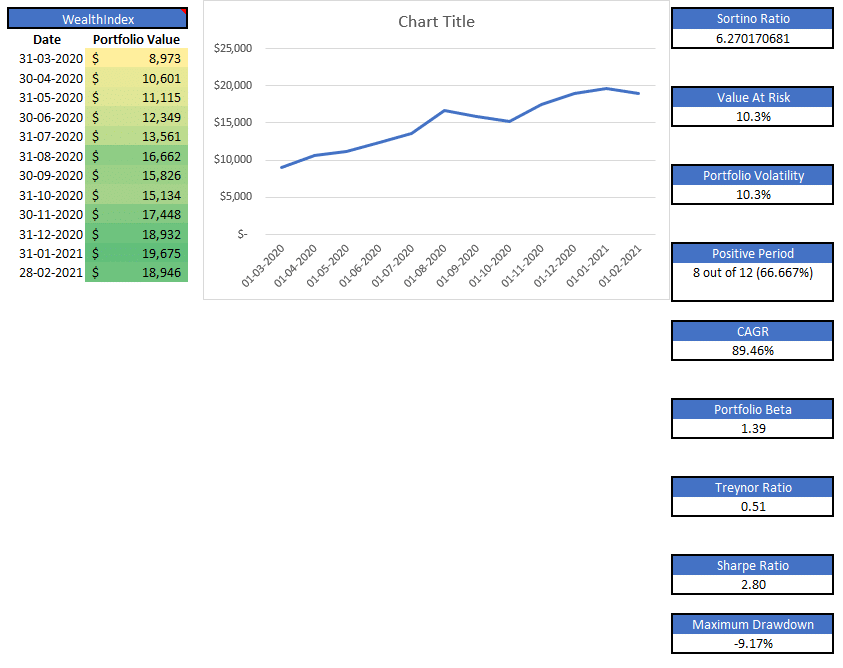
As you can see, the value of our portfolio is now $18,946 having only 8 positive periods out of 12 and a CAGR of 89.46%.
In order to aim for an improvement in the risk and growth structure, let’s dig into the correlation of all the 4 assets in the portfolio.
Correlation Table:
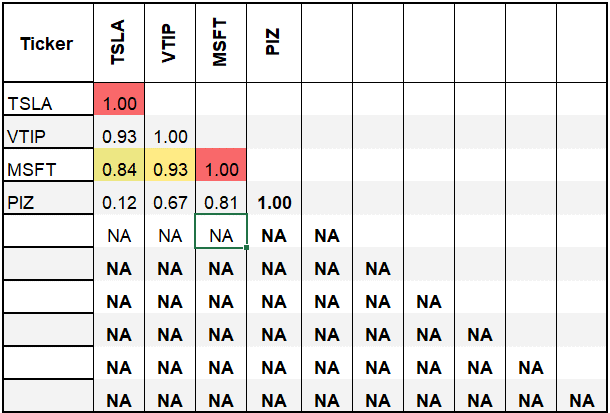
The Correlation between the 4 assets can be calculated from the ‘Correlation Matrix R’ whose link has been provided as the caption of the image.
MarketXLS provides ready-to-use templates for facilitating data collection and presentation of a Risk Parity Portfolio in an easy manner. In MarketXLS, there are several functions using which you will be able to compare two different kinds of portfolios in the same period or the same portfolio in 2 different periods using the “Comparisons” template
Let’s concentrate on the following points:
• In Risk Parity Portfolio, we try to reduce the risk of the asset in the portfolio. Indicator of risk is Standard Deviation. Since Tesla (TSLA/”>NYSE:TSLA) is very volatile, they have a very high standard deviation. To reduce the risk they offer, lets reduce their participation in our portfolio from 25% to 15%. This frees 10% of the total space of portfolio.
• Since Inflation Protected Bonds (NYSE:VTIP) have a lower CAGR than the other 2 assets which are left, we transfer the weightage of 10% from Inflation Protected Bonds to MSFT equity. (MSFT/”>NYSE:MSFT).
• Our software will also provide the Correlation between different assets which would facilitate you in determining the weight to be assigned to a particular asset in the portfolio. Looking at the table which shows the monthly correlation of the assets, we can see that Invesco ETF has a low correlation with the other 3 assets. As mentioned earlier, the low correlation helps in reducing the overall risk of the portfolio, we allocate the freed up 10% weightage to the Invesco Developed Markets Momentum ETF. (NYSE:PIZ)
Concluding from the above three points, we can see the allocation of the new portfolio as follows:
• 15% Tesla (TSLA)
• 15% Vanguard Short Term Inflation Protected ETF (VTIP)
• 35% Microsoft (MSFT)
• 35% Invesco ETF (PIZ)
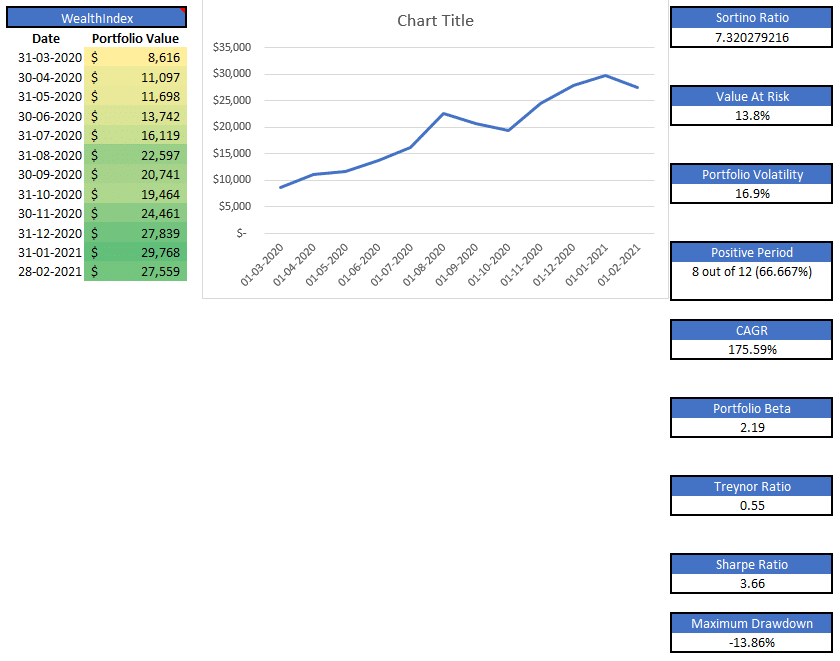
MarketXLS will now calculate the returns provided by the new Risk Parity Portfolio as compared to the Basic Portfolio. It will emphasize your focus on volatility and standard deviation, rather than on capital allocation.
MarketXLS has created a database of several templates including risk management, portfolio analysis and management and investment strategies covering how investors can manage risk across various sectors. These templates are designed in such a way that it will enable you to get all the historic as well as current information relating to all varieties of stocks.
Conclusion
There is a sharp rise in the CAGR. The value of the portfolio has turned out to be 27,559 USD after balancing it out with parity.
Since MSFT & PIZ have been allotted 10% more weightage than earlier, they will give more returns. Secondly, the volatility of TSLA has been reduced by reducing the weightage given to it by 10%. This is a perfect example of a Risk Parity Portfolio which can be created using MarketXLS.
The pictures and graphics used were taken from this software itself – MarketXLS.
For more such useful information, please visit https://marketxls.com/ .
Disclaimer
None of the content published on marketxls.com constitutes a recommendation that any particular security, portfolio of securities, transaction, or investment strategy is suitable for any specific person.
The author is not offering any professional advice of any kind. The reader should consult a professional financial advisor to determine their suitability for any strategies discussed herein.
the article is written for helping users collect the required information from various sources deemed to be an authority in their content. The trademarks if any are the property of their owners and no representations are made.
Reference
https://seekingalpha.com/article/4353057-building-risk-parity-portfolio-example

I invite you to book a demo with me or my team to save time, enhance your investment research, and streamline your workflows.