Put Ratio Spread (Explained With Example)
")
Meet The Ultimate Excel Solution for Investors
- Live Streaming Prices Prices in your Excel
- All historical (intraday) data in your Excel
- Real time option greeks and analytics in your Excel
- Leading data in Excel service for Investment Managers, RIAs, Asset Managers, Financial Analysts, and Individual Investors.
- Easy to use with formulas and pre-made sheets
What is the Put Ratio Spread?
The Put Ratio Spread is a neutral strategy in options trading adopted by traders. The strategy involves buying a select number of put options of a particular stock and expiration date at a higher strike price and selling more number of options at a lower strike price. It is an unlimited risk options trading strategy which offers a limited profit and is generally opted for by options trader when they believe that the particular stock will not grow and the price will fall, but not more than the strike price in the near term. This options trading strategy is majorly used to reduce the upfront costs of premium and in some cases, upfront credit can also be received. The put ratio strategy permits you to buy a put that is at-the-money or slightly out-of-the-money without paying the complete price. The goal is to obtain the put with strike B for a credit or a very small debit by selling the two puts with strike A.
For example, a 3:1 put ratio spread can be implemented by buying a number of puts at a higher strike price and selling three times the number of puts at a lower strike price.
Profit Potential in Put Ratio Spread
The maximum profit one can achieve through the put ratio spread options trading strategy is limited. The maximum profit occurs when the stock price expires at the strike price of the put options sold. At the lower strike price, all the written puts expire worthlessly, and the profit is simply the number of shares multiplied by the net debit. The formula for calculating your net debit per share is as follows.
Net debit = (Strike Price of Long Put – Strike Price of Short Put)+ (Net Premium – Commissions Paid)
Risk Involved in Put Ratio Spread
Put Ratio Spread is a bearish strategy. It has an unlimited downside risk and almost nil upside risk. One can lose a large amount when the stock price falls below the breakeven price on the expiration date of the put option. Any loss which occurs when the stock price increases are restricted to the debit taken. The formula for calculating the loss is as follows.
Loss = Strike Price of the Short Puts + Commissions Paid – Max Profit – Price of Underlying Stock
Put Ratio Spread Example
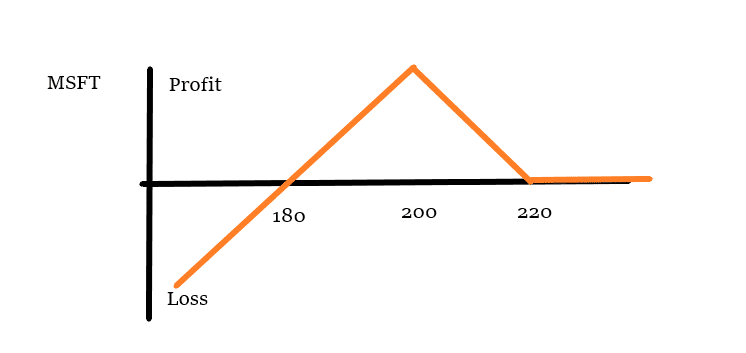
Let’s look at an example to understand Put Ratio Spread better. The Microsoft Corporation Stock is currently(Nov 2020) priced at $215. An options trader believes that the price of the stock will fall and uses put ratio spread strategy to earn a profit. He executes a 2:1 put ratio spread by buying a DEC 220 put for $200 and selling two DEC 200 puts for $100 each. This implies that the net debit taken is $20.
Let’s look at the maximum profit scenario. If the stock falls to $200 upon expiration then max profit can be earned by selling the long put option. The short puts expire worthlessly but the long puts expire in the money. The maximum profit will amount to $20 x 100 = $2000
If the stock of Microsoft drops to $180, then all the options expire in money in December. This is the breakeven price. The trader can sell his long put and earn back the loss incurred from the expiration of the short put option. However, once the price of the stock goes below the breakdown mark of $180, then the losses incurred have no limit. For example, if the strike price in December is $150, the 200 put is now worth $5000 each and the 220 put is now worth $7000, so the net loss incurred would be of $3000. The benefit of this strategy is that there exists no upside risk. If the strike price goes above $220, then all the options expire and there will be no loss.
How To Manage The Risk in Put Ratio Spread Strategy?
The Put Ratio Spread is opted for by moderately bearish investors because the investors can make maximum profit only when the stock price drops to a lower strike. On the other hand, the profits will almost be nil if the price of the underlying stock increases. One should follow a strict stop loss to limit their losses as the put ratio spread trading strategy is exposed to unlimited risk if the stock breaks lower than the lower strike price.
Disclaimer
None of the content published on marketxls.com constitutes a recommendation that any particular security, portfolio of securities, transaction, or investment strategy is suitable for any specific person.
The author is not offering any professional advice of any kind. The reader should consult a professional financial advisor to determine their suitability for any strategies discussed herein.
For more information about other options trading strategies or about put ratio spread you can visit –
1) Put Ratio Spread explained here(https://www.5paisa.com/articles/put-ratio-spread-explained)
2) Put Front Spread here(https://www.optionsplaybook.com/option-strategies/put-ratio-vertical-spread/)
3) Options Guide explains Put Ratio here(https://www.theoptionsguide.com/put-ratio-spread.aspx#:~:text=The%20put%20ratio%20spread%20is,at%20a%20different%20strike%20price.)
4) Professional Risk Management here
5) Covered Puts here
Get Market data in Excel easy to use formulas
- Real-time Live Streaming Option Prices & Greeks in your Excel
- Historical (intraday) Options data in your Excel
- All US Stocks and Index options are included
- Real-time Option Order Flow
- Real-time prices and data on underlying stocks and indices
- Works on Windows, MAC or even online
- Implement MarketXLS formulas in your Excel sheets and make them come alive
- Save hours of time, streamline your option trading workflows
- Easy to use with formulas and pre-made templates

I invite you to book a demo with me or my team to save time, enhance your investment research, and streamline your workflows.