Put Ratio Backspread Strategy (Manage Your Risk)
")
Meet The Ultimate Excel Solution for Investors
- Live Streaming Prices Prices in your Excel
- All historical (intraday) data in your Excel
- Real time option greeks and analytics in your Excel
- Leading data in Excel service for Investment Managers, RIAs, Asset Managers, Financial Analysts, and Individual Investors.
- Easy to use with formulas and pre-made sheets
Trading of options is increasing day by day, as it provides an opportunity for an investor to gain profit. But one can’t deny the fact that options involve risk and uncertainties. The risk for the option buyer is limited while it is unlimited for the option seller. So one needs to be very careful while trading in options. Investors can use various strategies to limit their risk and gain profits. Put Ratio Backspread is one such strategy.
What is the put ratio backspread?
Put ratio backspread involves buying more puts at a lower strike(OTM) and selling fewer puts with a higher strike(ITM). Long and short puts must have the same underlying asset and expiration date. It is called as put ratio backspread because investors built the ratio of long and short puts, say 2:1, 3:1, 3:2, etc. This strategy provides unlimited profit with limited potential risk. Investors can build this strategy on zero cost, net credit, or sometimes on the net debit depending upon the variation of long and short puts.
When to execute?
- When an investor has a bearish view on the stock and expects it will go down considerably.
- Put ratio backspread works best on the highly volatile stock, as it provides an opportunity to earn a limited profit if the stock moves in the upward direction and unlimited profit on the downside movement of the underlying asset.
- Put ratio backspread is applied when the underlying asset is greatly influencing by the events like quarterly reports of the company, election results, etc.
Example of Put Ratio Backspread
Suppose the stock of XYZ is currently at $47, an investor has a bearish view. He sells 1 XYZ 50.00 put at $4 and buys 2 XYZ 45.00 puts at $1.50(1Lot=100 shares).
Net Cash Flow= Premium received – Premium Paid i.e $1 (Net Credit).
Profit and Loss position at different spot prices on the expiration date-
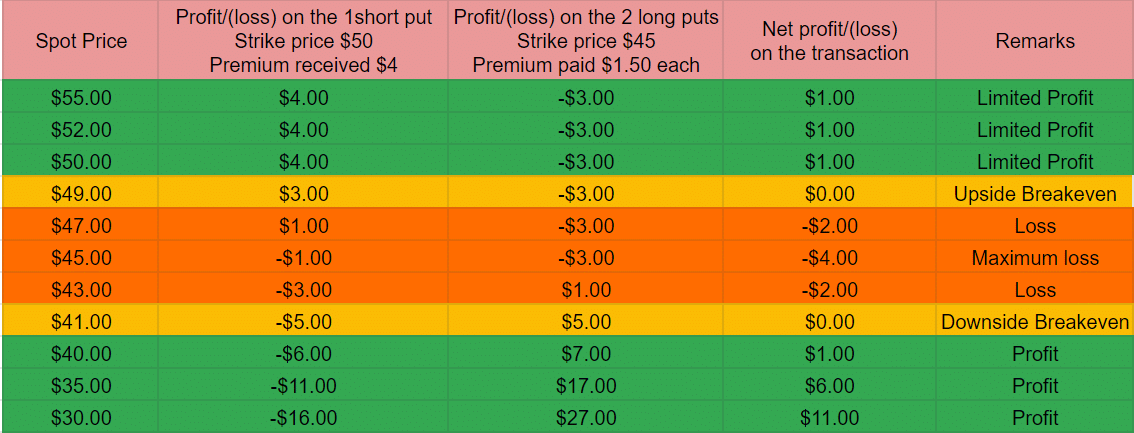
It is visible from the above table
- We will suffer a maximum loss of $400 ($4*100) if the stock closes at the long put strike of $45 as both of our long puts will become worthless.
- There are two break-even points at $41(downside) and $49(upside).
- If the spot price remains higher than $49(upside break-even) we will earn a limited profit of $100(only in case of net credit spread).
- The loss will incur if the stock remains in the range of $42-$48.
- Profits will increase as long as the stock moves down beyond the $41 (downside break-even).
Key Metrics
- Maximum Loss
Maximum Loss = (Strike Difference – Net Credit)*100
= $(5-1)*100
= $400 - Upside Breakeven
Upside Breakeven = Short Strike – (Net Credit / No. of Short Puts)
= $50 – ($1/1)
= $49 - Downside Breakeven
Downside Breakeven = Long Strike – (No.Short Puts * Strike Difference) + Net Credit
= $45 – (1*5) + $1
= $41
Payoff Graph Of Put Ratio Backspread (Net Credit Spread)
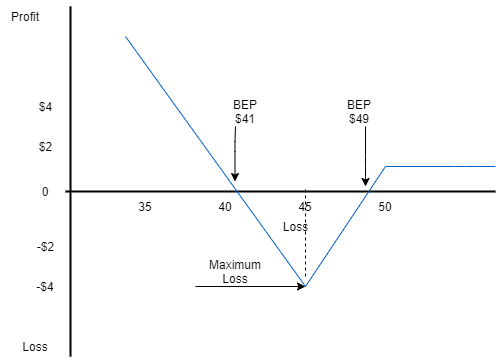
From the above graph, it can be concluded:
- Unlimited profits can be earned as the stock goes down.
- Maximum loss occurs at the long strike $45 as both the option will become worthless.
- Limited profits can be earned if the stock moves upward.
- There are two breakeven points in this strategy.
Payoff graph for the different cost strategies
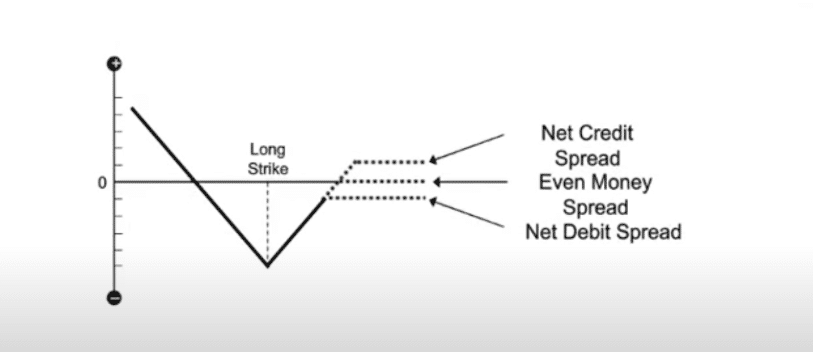
- Net Credit Spread
When the premium received on the short put is greater than the premium paid on long puts, a net credit spread is being created. With net credit spread, limited profit can be earned if the underlying asset moves upwards beyond the upside breakeven.
For example: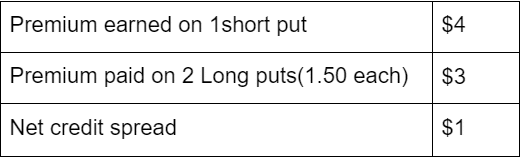
- Even Money Spread
When the difference in the premium earned on writing puts and buying puts is zero, even money spread is being created. It is also called as “Zero Cost Strategy”. It doesn’t provide an opportunity to earn a limited profit if the stock moves upward.
For example: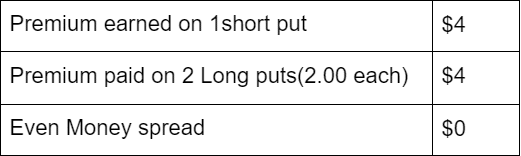
- Debit Money Spread
When the premium received on the short put is lesser than the premium paid on long puts, the net debit spread is being created. It will increase the cost of transactions and the potential risk of the stock.
For example: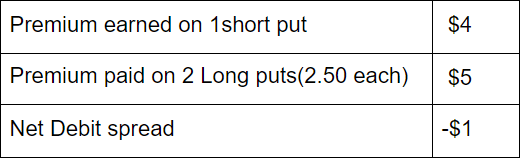
Advantages of Put Ratio Backspread
- To lower down the strategy cost.
- To earn higher profits in case of a sharp price decline.
- To generate profit even if the stock doesn’t move as per expectation(In case of net credit).
- To limit the loss in the worst-case scenario.
Limitations of Put Ratio Backspread
- Range bound movements or slow decline can result in a loss.
- Downside break-even is lower when compared to the simple put purchase.
- This strategy is not suitable for the less volatile stocks.
Conclusion
Put Ratio Backspread helps to limit the risk of an underlying asset and provides an opportunity to earn a profit on either side movement of the stock. But it does not eliminate the risk. It should be applied to the more volatile stocks. An investor must be sure that the stock moves down considerably and choose an appropriately long and short strike. The risk varies with the ratio of long and short puts and the difference in their strike price.
Disclaimer
None of the content published on marketxls.com constitutes a recommendation that any particular security, portfolio of securities, transaction, or investment strategy is suitable for any specific person. The author is not offering any professional advice of any kind. The reader should consult a professional financial advisor to determine their suitability for any strategies discussed herein. The article is written for helping users collect the required information from various sources deemed to be an authority in their content. The trademarks if any are the property of their owners and no representations are made.
Reference
Learn more about options trading here
Learn more about options and various strategies here
Get Market data in Excel easy to use formulas
- Real-time Live Streaming Option Prices & Greeks in your Excel
- Historical (intraday) Options data in your Excel
- All US Stocks and Index options are included
- Real-time Option Order Flow
- Real-time prices and data on underlying stocks and indices
- Works on Windows, MAC or even online
- Implement MarketXLS formulas in your Excel sheets and make them come alive
- Save hours of time, streamline your option trading workflows
- Easy to use with formulas and pre-made templates

I invite you to book a demo with me or my team to save time, enhance your investment research, and streamline your workflows.