Stock Portfolio Analysis
For the neophytes, let’s start right from the basics.
What is Stock Portfolio Analysis?
Stock Portfolio analysis is the study of an investment portfolio to keep a regular track of the risks and returns provided by the stocks in the Portfolio. It is done to determine the Portfolio’s suitability and aptness concerning the investor’s needs and risk-taking capacity.
It evaluates a given stock of a portfolio /the whole portfolio on a risk-return basis depending on various factors like inflation, deflation, the historical performance of an asset class, time horizon, etc.
What is the Importance of Stock Portfolio Analysis?
The current financial environment is dynamic. The business and economic situations are changing rapidly, and hence, the needs and requirements of the people are also changing accordingly.
A portfolio depends on the following three factors:
Time Horizon
Investment objectives
Risk Tolerance
A change in these three factors or a change in your needs, preferences, requirements, and situations would result in a difference in the Portfolio structure.
Stock Portfolio Analysis using MarketXLS
There is a template in MarketXLS that facilitates stock portfolio analysis. The Stock Portfolio Tracking Spreadsheet (SPTS) enables you to keep track of your investment portfolio.
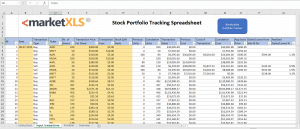 All you need to do is enter transactions in the Input_transactions sheet. Enter data only in the cells colored yellow. Everything else is calculated automatically by the spreadsheet once you click on the “Recalculate Portfolio Tracker” button in the Input_transactions sheet. You should not change formulas or values in any other cells in the file.
Supported transaction types are:
1. buy
2. sell
3. div (dividends)
4. split
From the input transactions sheet, you can keep track of the following information:
• Previous units
• Cumulative units
• Transaction Value
• Previous Cost
• Cost of Transaction
• Cumulative Cost
• Avg Stock Price
• Gains/Losses from Sale & Div
• Realized Gain/Loss %
Another sheet of the template contains the information about our Portfolio based on transactions that we have entered in the “Input_Transactions” sheet.
All you need to do is enter transactions in the Input_transactions sheet. Enter data only in the cells colored yellow. Everything else is calculated automatically by the spreadsheet once you click on the “Recalculate Portfolio Tracker” button in the Input_transactions sheet. You should not change formulas or values in any other cells in the file.
Supported transaction types are:
1. buy
2. sell
3. div (dividends)
4. split
From the input transactions sheet, you can keep track of the following information:
• Previous units
• Cumulative units
• Transaction Value
• Previous Cost
• Cost of Transaction
• Cumulative Cost
• Avg Stock Price
• Gains/Losses from Sale & Div
• Realized Gain/Loss %
Another sheet of the template contains the information about our Portfolio based on transactions that we have entered in the “Input_Transactions” sheet.
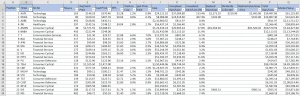
In our example, we have shown 23 positions in our Portfolio.
This sheet shows the information of the stocks in our Portfolio. You don’t have to enter anything on this sheet. It is based on calculations, and it will automatically calculate the information about all the stocks in your Portfolio.
It entails a range of information starting from the sector in which the stock lies to your current position’s market value.
The main focus of an investor would be on the following information:
1. DPS – Dividend per Share
2. Yield on Cost
3. Cost
4. Total Gain/Loss
5. Market Value
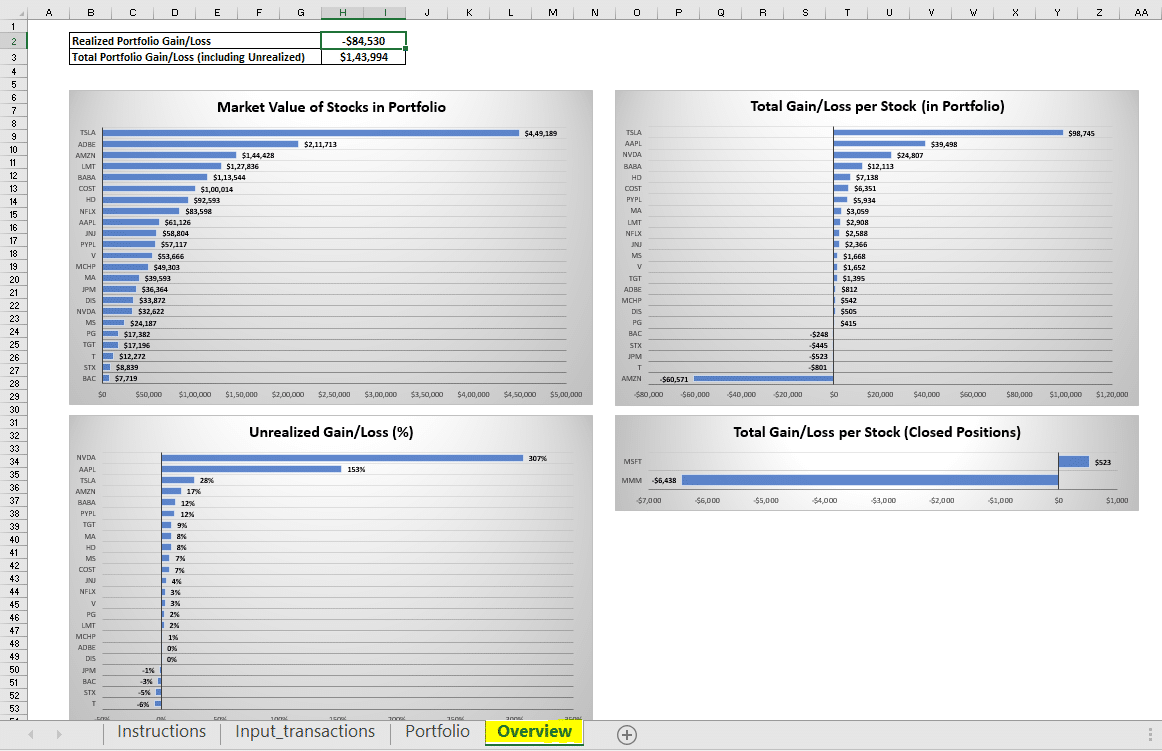
Lastly, our template also contains a sheet that provides an overview of the Portfolio’s performance using graphs and diagrams.
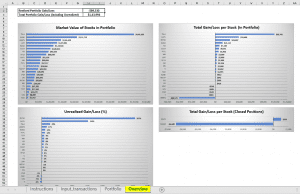
The overview shows the performance of the following information:
1. The market value of Stocks in Portfolio
2. Total Gain/Loss per Stock
3. Unrealized Gain/Loss %
4. Total Gain/Loss per Stock on a Closed Position basis
The Bottom Line
MarketXLS is an Excel-based Investment Research Solution for Serious Investors.
We can conclude that the following points should be noted while investing:
Rule 1: Invest considering the time horizon
Rule 2: Invest considering the growth prospects and risk aspects
Rule 3: Analyse the Portfolio regularly for being safe from the changes in the market
Stock Portfolio Analysis is essential for all the investors who have held their positions in the market. MarketXLS facilitates investors to keep track of their portfolios.
Thus, you can easily keep track of the stocks/ positions you have held in your Portfolio using the template provided by MarketXLS.
Disclaimer
None of the content published on marketxls.com constitutes a recommendation that any particular security, portfolio of securities, transaction, or investment strategy is suitable for any specific person.
The author is not offering any professional advice of any kind. The reader should consult a professional financial advisor to determine their suitability for any strategies discussed herein.
The article is written to help users collect the required information from various sources deemed to be an authority in their content. The trademarks, if any, are the property of their owners, and no representations are made. All trademarks referenced are the property of their respective owners. Other trademarks and trade names may be used in this document to refer to either the entity claiming the marks and names or their products. MarketXLS disclaims any proprietary interest in trademarks and trade names other than its own or affiliation with the trademark owner.
Reference
https://www.thebalance.com/portfolio-analysis-for-beginners-4154345