Most Undervalued Stocks – Tracking Valuation (Using Marketxls Template)
")
Meet The Ultimate Excel Solution for Investors
- Live Streaming Prices Prices in your Excel
- All historical (intraday) data in your Excel
- Real time option greeks and analytics in your Excel
- Leading data in Excel service for Investment Managers, RIAs, Asset Managers, Financial Analysts, and Individual Investors.
- Easy to use with formulas and pre-made sheets
Undervalued stocks or securities are equity shares that have a market value lower than their intrinsic value. The undervalue could be due to a host of reasons ranging from sector-specific, socio-economic or overall market slow down.
For instance, the share of Company A is selling in the market at a price of $30; however, its intrinsic value is estimated to be $55. Hence, Company A’s shares are valued lower than its potential owing to volatile market conditions.
The process of investment in undervalued stocks is known as value investing. It was pioneered by Benjamin Graham and later followed by his student and protégé Warren Buffet.
Undervalued stocks have considerable potential to yield substantial returns if investors can properly reckon and analyze the different variables which are related to such stocks.
Undervalued Stocks that one may consider while investing :
1. BP plc (NYSE: BP) (PETROLEUM SECTOR)
British oil major BP is one of several beaten-down oil stocks that analysts say could make excellent long-term investments as travel and industrial oil demand recover. Analysts say an oil market recovery is bullish in the near term, but BP is also making the most aggressive push among all oil majors to shift its long-term business away from fossil fuels and toward renewable energy. BP shares are down around 35% in the past year, but the stock still pays a 6.7% dividend.
BP is also planning to invest tens of billions of dollars over the next decade or so on renewable energy projects.
2. Wells Fargo (NYSE: WFC) (FINANCIAL SECTOR)
Bank stocks have rallied significantly since the November elections, but megabank Wells Fargo still has a long way to go to get back to where it was a year ago. Wells Fargo is still operating under an asset cap implemented by the Federal Reserve in 2018 as punishment for a series of scandals. However, analysts says Wells Fargo is still one of the leading U.S. deposit gatherers in a favourable banking environment. WFC stock is down around 27% over the past year but Morningstar™ has a “buy” rating and a $45 fair value estimate.
Wells Fargo looks like a good bargain at current prices. Wells Fargo Stock is trading well below the bank’s tangible book value per share.
3. Telefonica (NYSE: TEF) (TELECOMMUNICATIONS SECTOR)
Telefonica is the leading telecommunications company in Spain. The stock is down almost 35% over the past year, but analysts say the dip is a buying opportunity. Telefonica recently announced the sale of 30,700 towers to American Tower Corp (AMT) for $9.4 billion. Molina says the sale of passive infrastructure allows Telefonica to pay down debt or invest in building and upgrading its networks. Following the sell-off, Telefonica shares trade at just 9.5 times forward earnings and pay a 9.9% dividend. Morningstar™ has a “buy” rating and a $10.20 fair value estimate for TEF stock.
4. Suncor Energy (NYSE: SU) (ENERGY SECTOR)
Suncor Energy is a Canadian integrated oil sands exploration and production company. Analysts say Suncor shares are undervalued, trading at just 16.8 times forward earnings. He says the market is too narrowly focused on the temporary disruption in demand for refined products, but Suncor’s business will be back generating positive free cash flow as soon as industrial demand rebounds. Warren Buffett’s Berkshire Hathaway (BRK.A, BRK.B) also owns 19.2 million shares of Suncor stock, making it a rare Buffett oil investment. Morningstar™ has a “buy” rating and a $24 fair value estimate for SU stock.
They cash flow very well at $48 WTI oil price, and that will support a much higher share price without any further rise in oil price. Just the same, oil prices will likely rise as oil demand recovers.
They have massive reserves, up to 27 years with their present land base. This is better than almost every other major oil company in the world.
They are currently priced in the mistaken notion that oil will fall into disuse shortly, when the truth is that to replace oil, a great amount of oil will be needed to build out its replacement, and it will take decades.
5. Kinder Morgan (NYSE: KMI) (ENERGY SECTOR)
Kinder Morgan is one of the largest U.S. midstream energy companies, specializing in natural gas transport. During its investor day event in January, Kinder Morgan maintained its 2021 guidance and highlighted its environmental, social, and governance profile. Analysts say Kinder ranks best among 191 refinery and pipeline stocks in Morningstar™ Sustainalytics ESG risk rankings.
Kinder Morgan shares are down around 31% from a year ago and trade at just 16.3 times forward earnings. The stock pays a generous 6.95% dividend. Morningstar has a “buy” rating and a $21 fair value estimate for KMI stock.
Key ratios to determine the value of a stock :
Comprehensively, there are 100s of ratios that investors can study or use in different types of analysis. Below are a few popular ratios that analysts use to get some quick insight into a stock’s price.
1. P/E ratio ( price-to-earnings)
It is the price a company’s shares trade at divided by its earnings per share for the past twelve months. Given a company’s historical earnings per share results, it could be easy for an investor to find an estimated price per share of a stock using the average of P/Es from some comparable companies. Moreover, viewing an actual P/E of a company can also provide insight on the reasonability of the stock when compared to its peers.
Lower P/E’s are usually more reasonable but can also indicate potential undervaluation if considerably lower than peers.
2. P/B ratio ( price-to-book)
The price to book is calculated by share price divided by book value per share. In this ratio, book value per share is equal to a company’s shareholder’s equity per share, with shareholders’ equity serving as a quick report of book value.
Similar to P/E, the higher the P/B, the more inflated a stock’s price is. Vice versa, the lower the P/B the greater the potential for upside. Both P/E and P/B are often best viewed in comparison to the ratios of their peers. P/B ratios under 1 are typically considered solid investments.
3. P/S ratio ( price-to-sales)
The price-to-sales (P/S) ratio is often popular because most companies do have sales. These sales will also show some type of growth rate.
The P/S ratio is figured by dividing the current stock price by the 12-month sales per share. The current stock price can be found by plugging the stock symbol into any major finance website.
A low P/S ratio in comparison to peers could suggest some undervaluation. A high P/S ratio would suggest overvaluation.
4. PEG ratio ( price-to-earnings growth ratio)
The price-to-earnings growth ratio (PEG) is an extended analysis of P/E. A stock’s PEG ratio is the stock’s P/E ratio divided by the growth rate of its earnings.
The lower the PEG ratio, the more the stock may be undervalued given its earnings performance. The degree to which a PEG ratio value indicates an over or under-priced stock varies by industry and by company type. Also, a PEG ratio below one is typically thought to indicate that a stock may be underpriced but this can vary by industry.
How can we use MarketXLS to know the ratios of different stocks?
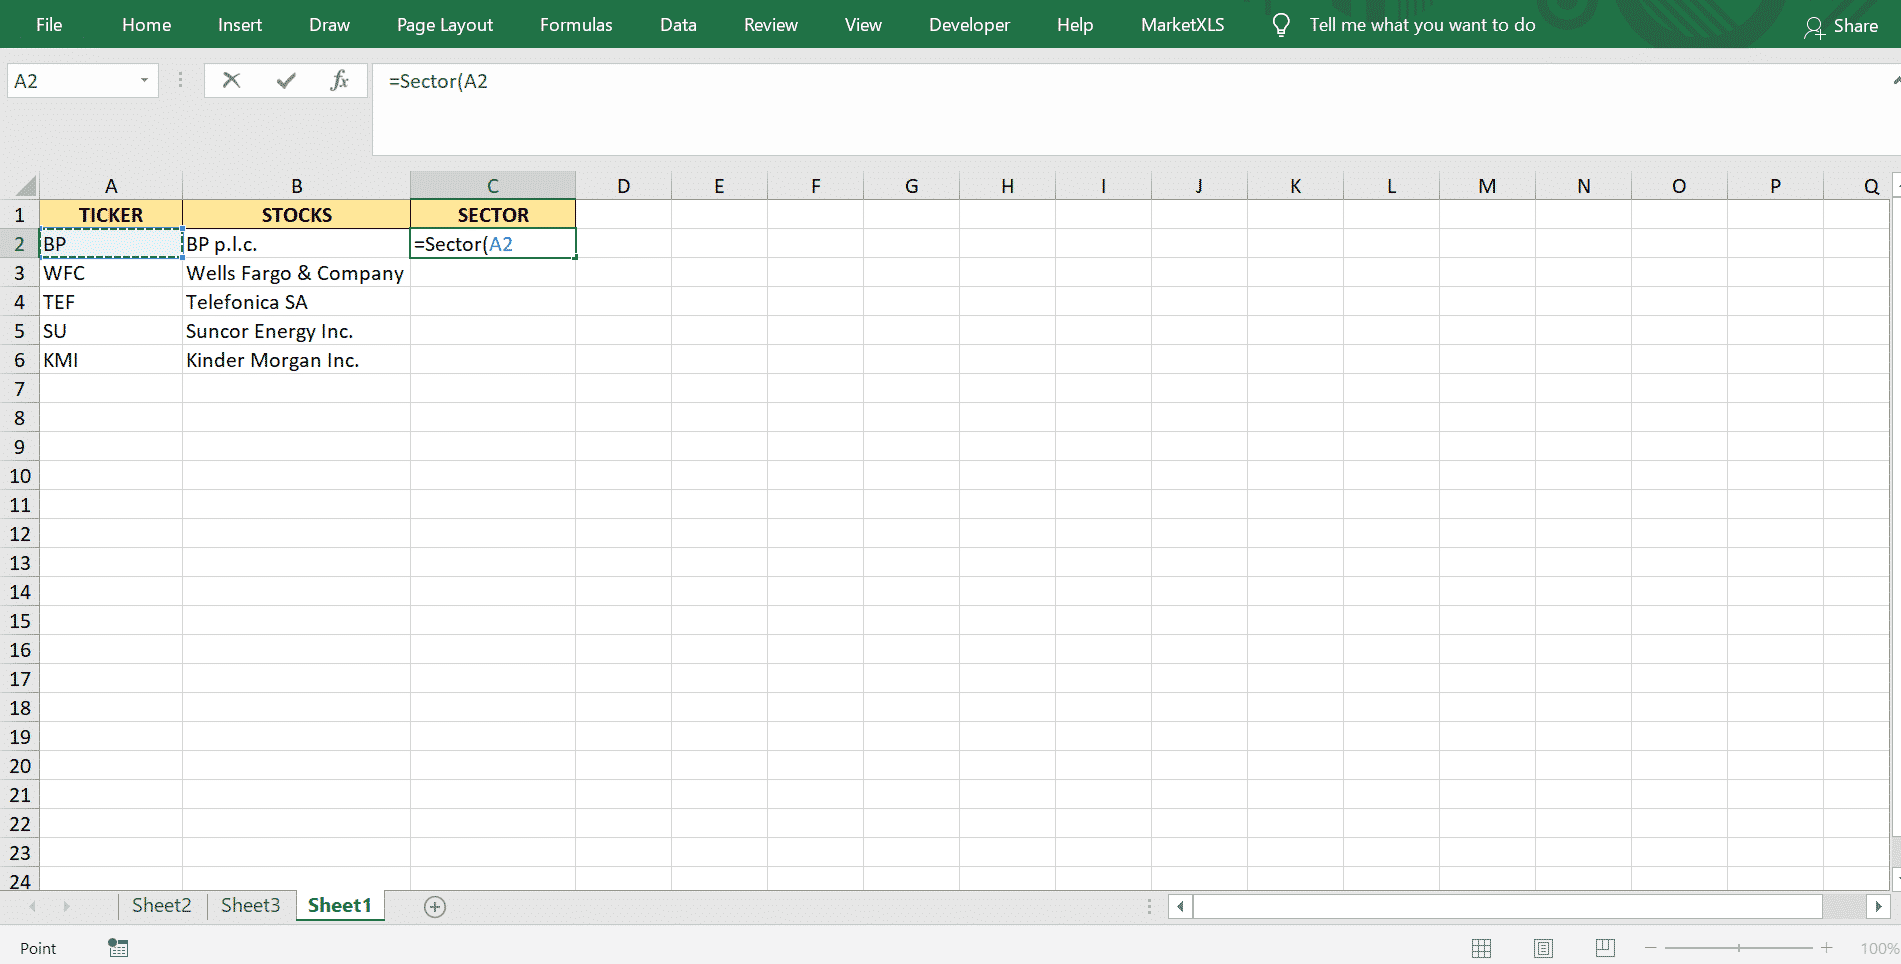
Step 1: Open a new excel workbook & enter the cells with ticker symbols and stock names. MarketXLS provides a range of functions to get information about company stocks using their ticker symbols. Here I have used the sector function to know about the sectors. Use =sector() and select the appropriate ticker. Press enter & drag down the cell to perform flash fill for all stocks.
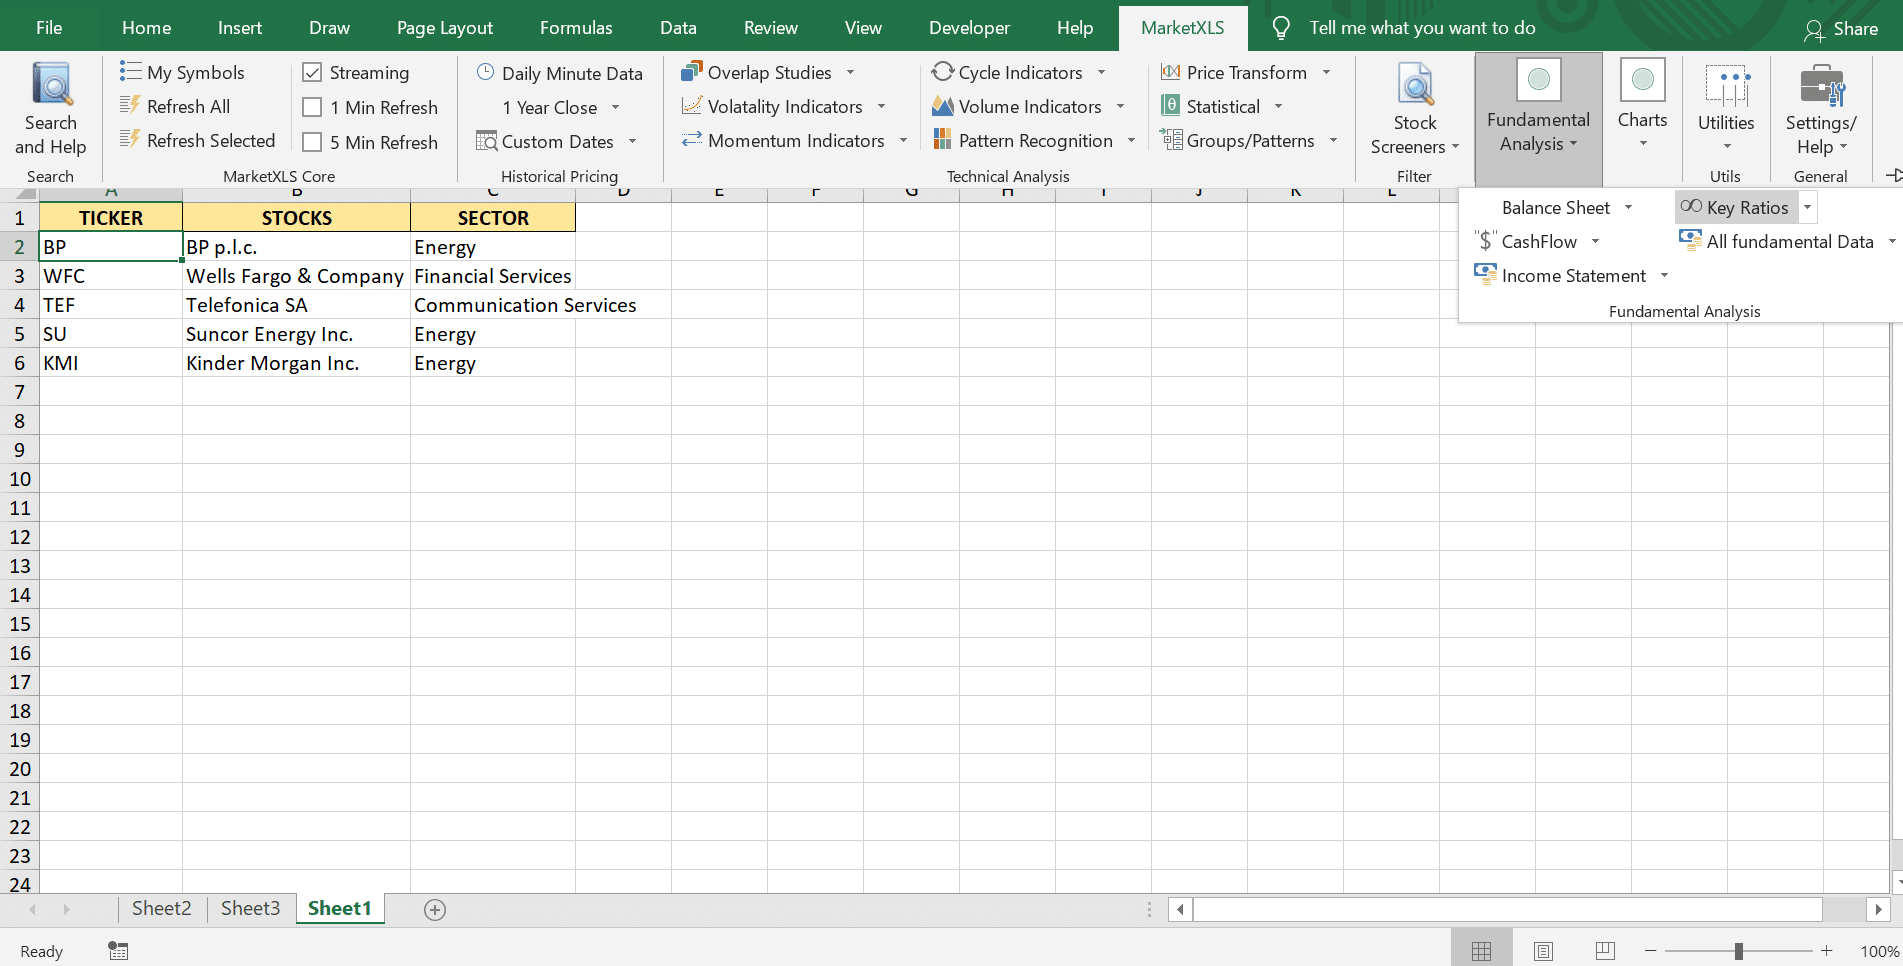
Step 2: Select the ticker symbol. Go to MarketXLS tab in the ribbon. Click the fundamental analysis option and select key ratios.
Step 3: Find an ample amount of ratios for that particular stock in a newly created worksheet. Here I have highlighted the important ratios mentioned earlier in this article. Find the desired ratio from the list & compare it with the industry average ratio to determine whether the stock is undervalued, overvalued, or fairly valued.
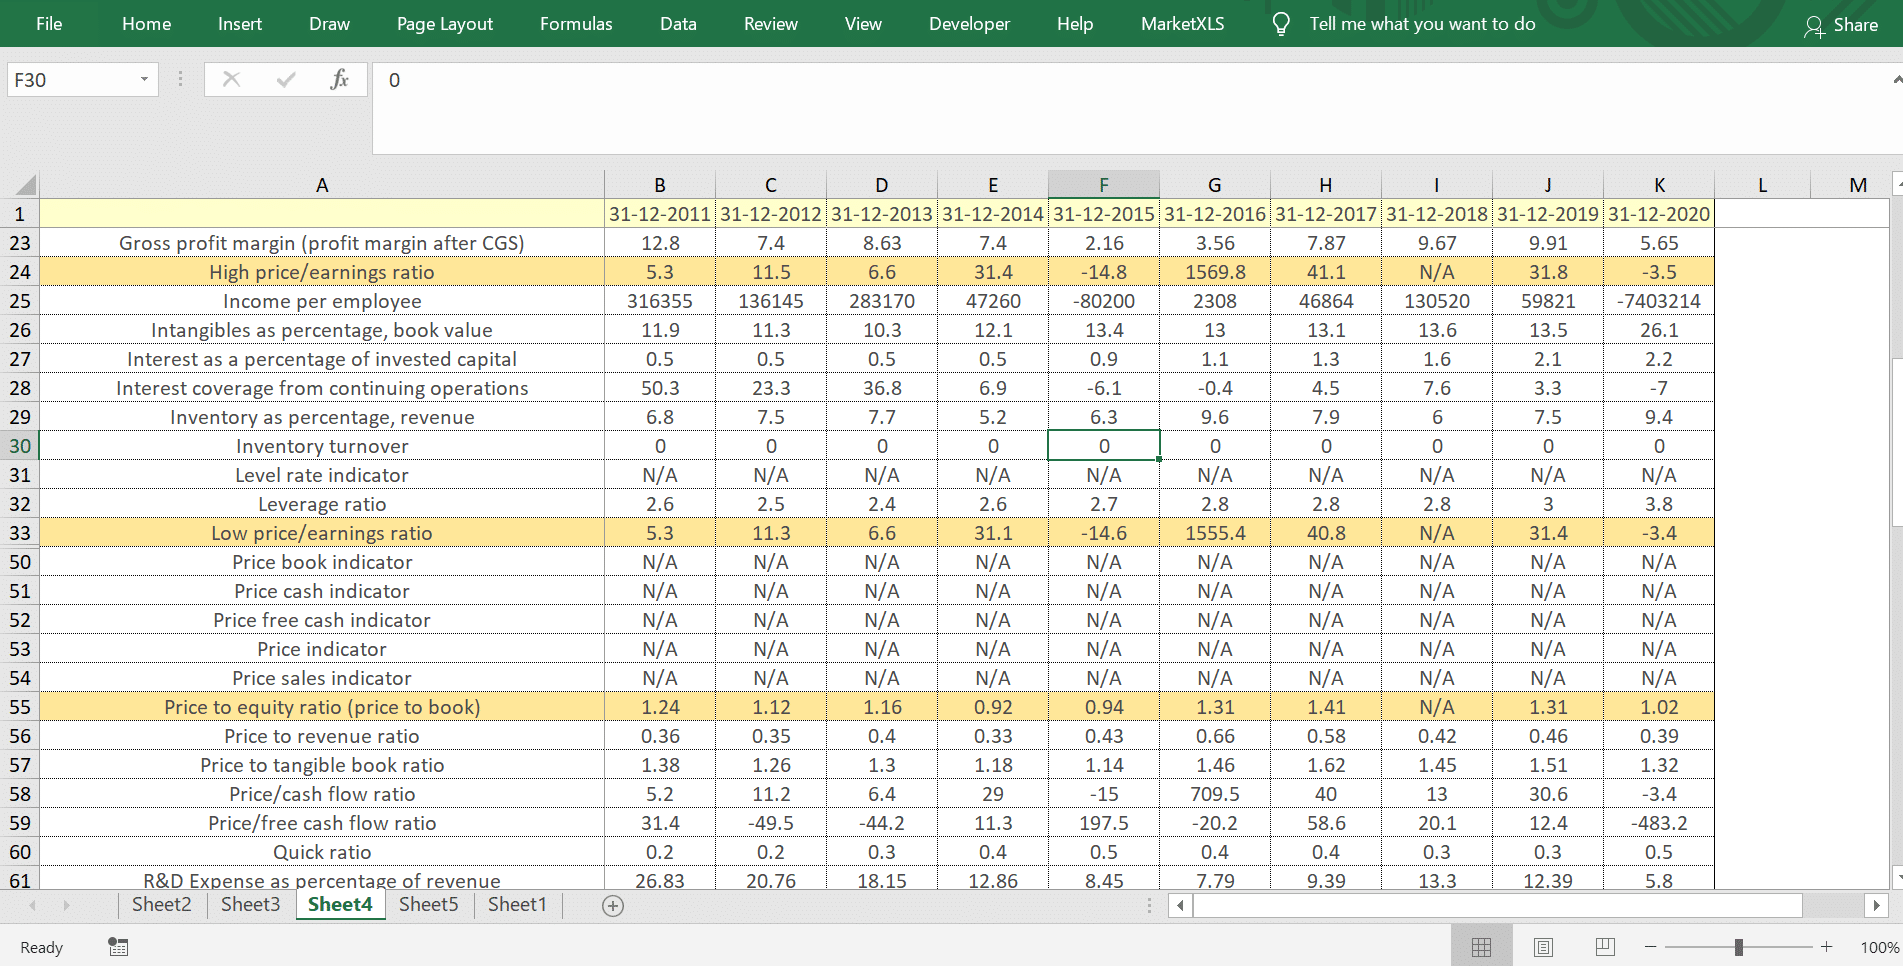
Here I took British petroleum company ltd. as an example.
As you can see ( in the list) the stock’s P/B ratio has been near 1 across the years and any P/B ratio around 1 is a good investment. So it is safe to say that this is an undervalued stock.
Determining Valuation using MarketXLS template :
MarketXLS provides a host of tailor-made templates for valuing a company’s stock price and also comparing it with the peers in the industry.
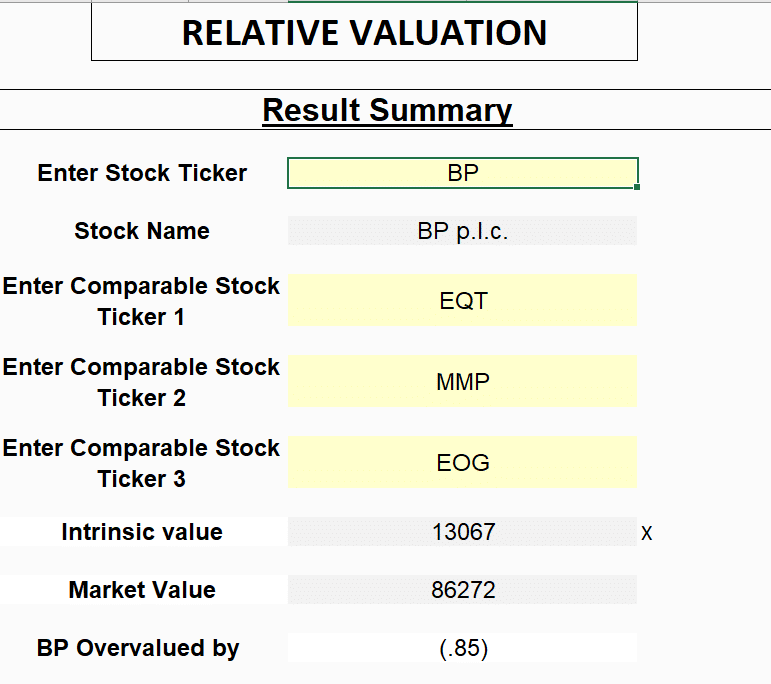
In the following example I have used the Relative Valuation template to compare BP’s stock with that of its peers like Eqt Corporation, Magellan midstream partners & Eog resources :
A relative valuation model is a business valuation method that compares a company’s value to that of its competitors or industry peers to assess the firm’s financial worth. The logic is that if similar companies are worth 10x earnings, then the company that’s being valued should also be worth 10x its earnings.
 How to use Relative Valuation template :
1.Enter Stock Ticker in cell E7 of this sheet 2.Enter Comparable Stock Ticker in cell E9, E11 and E13 of this sheet
It shows that BP is overvalued by (0.85) which implies it is actually undervalued.
Disclaimer:
All trademarks referenced are the property of their respective owners. Other trademarks and trade names may be used in this document to refer to either the entity claiming the marks and names or their products. MarketXLS disclaims any proprietary interest in trademarks and trade names other than its own, or affiliation with the trademark owner.
None of the content published on marketxls.com constitutes a recommendation that any particular security, portfolio of securities, transaction, or investment strategy is suitable for any specific person. The author is not offering any professional advice of any kind. The reader should consult a professional financial advisor to determine their suitability for any strategies discussed herein. The article is written to help users collect the required information from various sources deemed an authority in their content. The trademarks, if any, are the property of their owners, and no representations are made.
Reference :
https://money.usnews.com/investing/stock-market-news/slideshows/undervalued-stocks-to-buy
Image Source :
https://dailypik.com/undervalued-stocks-in-the-philippines-latest-list/

I invite you to book a demo with me or my team to save time, enhance your investment research, and streamline your workflows.