What is Times Interest Earned Ratio
Times interest earned ratio indicates a company’s ability to meet interest payments when they come due. The higher the ratio the more easily the company can meet its interest expenses. Times interest earned ratio is also known as Interest Coverage Ratio
Typically you would look at this ratio along with the debt to total assets ratio. The debt to total assets ratio measures the percentage of the assets provided by creditors. A higher debt to total assets ratio could raise doubts about the company’s ability to meet its obligations.
If a company has very high debt to total assets ratio and also a very high times interest and ratio, it would mean that even though the debt is high but with its operating income the company will be able to meet its obligations of interest expenses. So what you want to see here are high, times interest earned ratio.
This ratio is a solvency ratio, and it tells us how many times our income can cover our interest expense.
Times Interest Earned Ratio Formula
We can calculate times interest on earnings ratio as follows

We can calculate Debt to Total Assets Ratio is by dividing Total Debts by the Total Assets
You can use these two tools to analyze the long-term debt situation of the company. A very high debt to asset ratio and low times interest ratio can indicate financial difficulties. We must use these ratios with care when analyzing companies in different industries because of the difference in borrowing models. When analyzing financial services companies we need to look at this ratio differently against when analyzing a traditional manufacturing business.
Also, note that some companies may not have an interest expense but they may have interest income. For companies that have positive interest income, where they get more interest income than they what they pay, this ratio should not be calculated. If this ratio increases for a few years and there is no change in the debt, it may suggest operational inefficiency.
Calculate Times Interest Earned Ratio with MarketXLS Formulas
MarketXLS provides the formula as for earnings before interest and taxes and also for the interest expenses. So not only you could calculate the latest ratio but you can easily create a model to analyze it over last few years. MarketXLS is not a calculator but it provides the formula you need to make a calculator yourself. So, once you know how to calculate a ratio you can yourself use the component functions and make your own custom formulas.
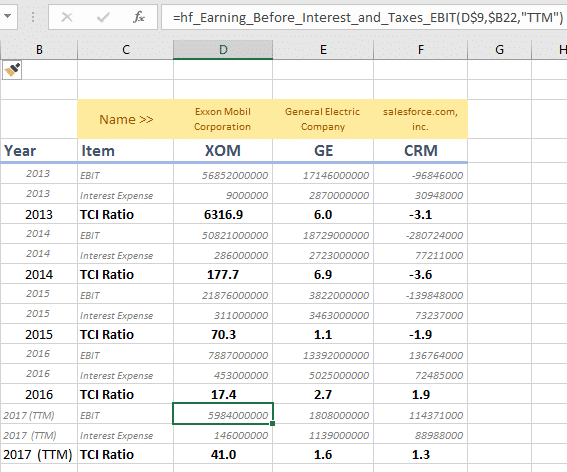
In the example below I calculate this ratio for a few companies.
TCI-Ratio-calculation.png” alt=”times interest earned ratio” width=”567″ height=”472″ />
Morningstar website also shows the CRM®ion=usa&culture=en-US”>same values.
What does this ratio reflect?
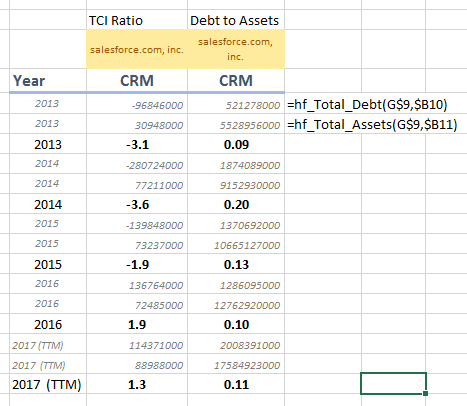
Let’s look at salesforce.com and see if we can make sense of consistent decline in the times interest earned ratio. So let’s first calculate the debt to asset ratio.

You may notice that from 2014 they have also been a consistent decline in the debt to the asset ratio as well. So overall, this looks like a good sign for salesforce.com because not only do seem to be earning more and more but also they seem to be getting stronger with respect to their debt situation.
Even though the time interest earned ratio is a favorable one, we must analyze it very carefully. A high ratio could also mean that the company is not managing its debt on its financial leveraged in a most efficient way. It could also mean that the company is the paying its debt fast to reduce its liabilities and is not investing enough in the growth of the company through new projects.
Other similar ratios on the same concept
There are some other useful ratios that are very similar in nature. The Fixed Payment Coverage ratio suggests the company’s ability to pay for the fixed payments with its operating income before tax. The cash coverage reflects a company’s ability to pay for its interest expenses with cash.
The EBITDA coverage reflects the company’s ability to pay for its average liabilities with EBITDA. And the cash coverage ratio reflects its ability to pay for average liabilities with the cash in hand.

