Introduction
A common investment theory is that securities that are owned by institutional investors tend to trade with a closer correlation to the financial performance of the company or, in the case of futures contracts, with the overall economy. Traders, therefore, will frequently look at volume and implied volatility to determine future price direction.
Investors look at call option volume along with the price to determine whether to take a particular stock position. In this article, we’ll look at what does the volume and Open Interest signify and what are the unusual option activities. We’ll also go into detail about how to identify the unusual options activity and what precautions need to be taken.
Volume and Open Interest
Volume and open interest are two key technical metrics that describe the liquidity and activity of options and futures contracts. “Volume” refers to the number of contracts traded in a given period, and “open interest” denotes the number of contracts that are active, or not settled.
Let’s look at the market signal and the inference that can be derived by comparing the increase/ decrease in volume and open interest in the option price.
| Price | Volume | Signal | Inference |
| Up | Up | Bullish | Indicates at the strength in the up move, and that the move is likely to continue |
| Up | Down | Cautiously Bullish | Indicates at weak buying pressure, due to which rally could run out of steam |
| Down | Up | Bearish | Indicates the strength in the down move, and that the move is likely to continue |
| Down | Down | Cautiously Bearish | Indicates weak selling pressure, due to which the decline could soon run out |
In short volume that confirms the price movement indicates the current trend will likely continue whereas volume that does not confirm price action indicates the trend is on a weaker footing.
| Price | Open Interest | Signal | Inference |
| Up | Up | Bullish | Indicates a new long position is being built and the uptrend in price is likely to continue |
| Up | Down | Cautiously Bullish | Indicates at short covering and the increase can halt once short-covering ends |
| Down | Up | Bearish | Indicates a new short position is being built and the downtrend in price is likely to continue |
| Down | Down | Cautiously Bearish | Indicates at long unwinding and the decline can halt once long unwinding ends |
In short open interest that confirms the price movement indicates the current trend will likely continue whereas open interest that does not confirm price action indicates the trend is on a weaker footing.
Understanding the theory behind options volume
Trading options based on volume assumes that the trading activity is being done by informed stock traders.
If the trader is anticipating good news about a stock, such as an earnings report that is expected to beat analysts’ expectations, then they will look to buy call options. Since the trader is anticipating that the share price will be increasing, they would be fine with buying the stock outright. However, the options contract will allow the investor to leverage their buying power.
On the other hand, if the trader is anticipating bad news about a stock, they will look to sell call options. This means that they are hoping to find buyers that have a different opinion of the stock who will pay them a premium to buy their call option.
As you can see, options volume is a complementary trading signal. If there is a volume on call options that is accompanied by a rising price for that call option indicates that professional traders believe the price of the stock is going to go higher. If there is a high call option volume that is accompanied by a declining call option price, it is a signal that there is speculation that the stock price will go lower.
Three Ways Options Activity Is ‘Unusual’
- One-way options market activity can be considered unusual is when the volume is exceptionally higher than its historical average.
- Another sign of unusual activity is the trading of a contract with an expiration date in the distant future. Usually, additional time until a contract expires allows more opportunity for it to reach its strike price and grow its time value.
- Contracts that are “out of the money” are also indicative of unusual options activity. These trades are made with the expectation that the value of the underlying asset is going to change dramatically in the future, and buyers and sellers will benefit from a greater profit margin.
How is it useful to know the unusual options volume?
The unusual options volume can help traders in many ways, including:
- Focusing on where there are potential trading opportunities. Traders will look for opportunities when the market value of an option diverges far from its expected value. The unusual trading activity could push option prices to overvalued or undervalued levels.
- Unusual option volume can alert traders if something notable is happening in a particular stock, sector, or within the market as a whole. By reading the options volume, stock price, and implied volatility, traders can get an insight into how the market is feeling about the stock.
Identifying Unusual Options Activity
The first prerequisite for unusual options activity is that the total volume must be multiples of its average daily volume, typically at least five times the average daily volume. The higher, the better.
While any option that is trading a high relative volume is worth taking a look at, we want to pay extra attention to the options that make large individual orders.
This indicates that one trader or institution is making a bet, suggesting that someone might have some insider knowledge. I consider a “large individual order” to be about the size of one day of average volume.
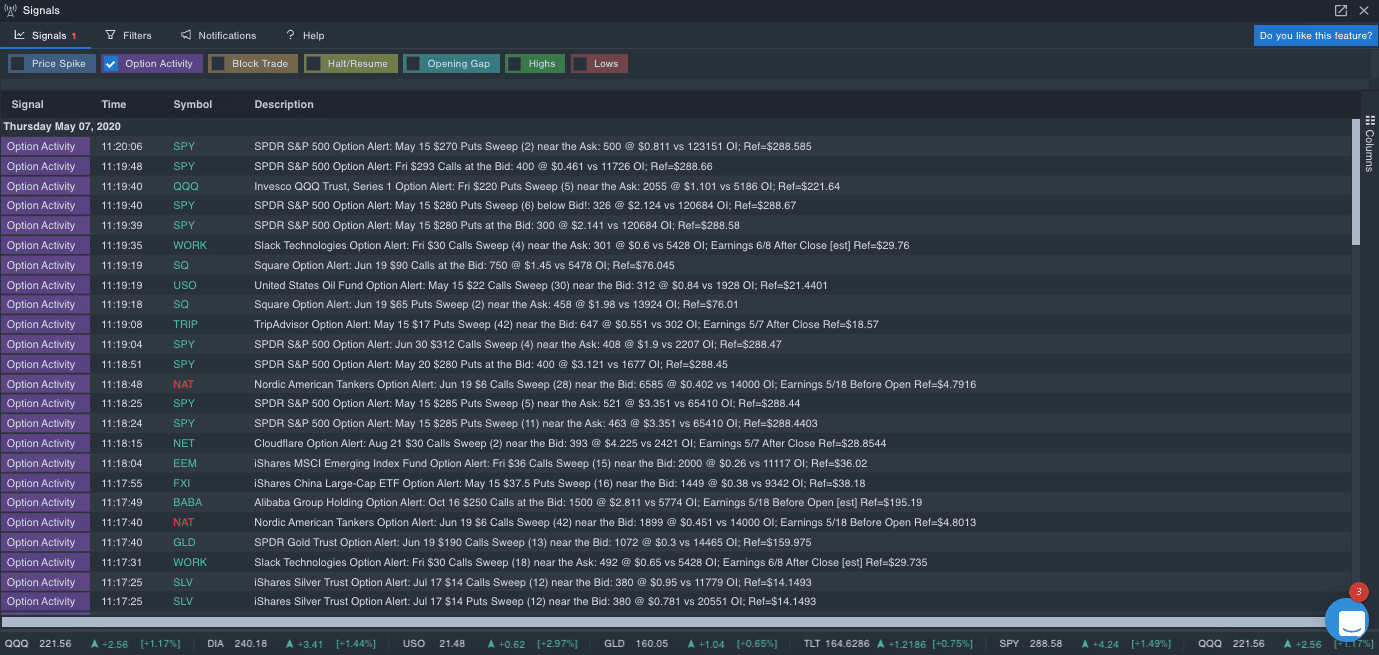
There are many screeners that scan for unusual options activity, and most trading/charting platforms have this capability built-in. Benzinga Pro is one such platform.
Need to be cautious
It’s essential to keep in mind that, frequently, unusual options activity is due to a large hedge taking place, rather than someone expressing a directional view.
In addition to the possibility of an unusual order simply being a hedge, the order could also be a closing order.
Most of the time, a closing order is somewhat easy to sniff out because there is usually an opening or closing marker placed on orders by the exchange or broker. However, this isn’t always the case.
In these situations, the way to decipher a closing order from an opening order is by observing the open interest. When volume is significantly higher than open interest, the chances are that the large order was an opening order.
Using unusual options activity as a strategy
Unusual options activity is an advantageous strategy that may greatly reward an investor if they are highly skilled, but for the less experienced trader, it should remain as another tool to make an educated investment decision while taking other observations into account.
Disclaimer
References
https://www.marketbeat.com/market-data/unusual-call-options-volume/
