Balance Sheet Ratios In Excel Using Marketxls

Meet The Ultimate Excel Solution for Investors
- Live Streaming Prices Prices in your Excel
- All historical (intraday) data in your Excel
- Real time option greeks and analytics in your Excel
- Leading data in Excel service for Investment Managers, RIAs, Asset Managers, Financial Analysts, and Individual Investors.
- Easy to use with formulas and pre-made sheets
We know that a company’s balance sheet provides a snapshot of a company’s financial position at a particular time. By looking at the balance sheet of a company, an investor can get lots of simple yet valuable insights. This includes things such as the company’s cash positions, its assets, its debt obligations, and more. However, by performing a few quick calculations, you can calculate some important balance sheet ratios in excel. These ratios can provide you a much better understanding of the financial position of the company. In this article, we will look at some of the common balance sheet ratios. Also, we will learn how to calculate these balance sheet ratios in excel using MarketXLS functions.
Download the Balance Sheet Ratios in Excel MarketXLS Template
The Balance Sheet ratios can be broadly divided into liquidity and solvency ratios.
Liquidity Ratios
The liquidity ratios measure a firms ability to fulfill its short-term obligations. There are two common variations of liquidity ratios:
Current Ratio: This is considered to be the most important measure of liquidity.
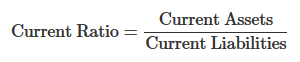
If the current ratio is less than 1, it means that the firm is facing liquidity crunch and may not be able to meet its short-term obligations.
Quick Ratio: This is a more conservative liquidity ratio and considers only the most liquid assets of the firm. Therefore, it excludes inventory and other less liquid assets from the current assets.
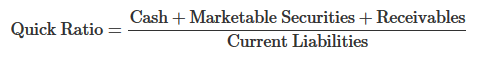
We can also calculate quick ratio as (Current Assets – Inventories)/Current Liabilities. The higher the quick ratio, the better the liquidity position of the company.
Solvency Ratios
Solvency ratios measure the financial risk of the firm and its ability to meet its long-term obligations. A higher ratio indicates higher financial leverage and a greater financial risk.
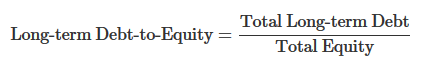
Long-term Debt-to-Equity Ratio
The long-term debt-to-equity ratio measures the long-term financing sources compared to its equity base. Long-term debt ratio indicates the firm’s ability to run its future operations.
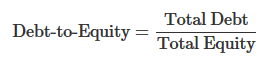
Debt-to-Equity Ratio
This measures the total debt in comparison to the equity base of the firm.
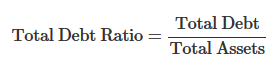
Total Debt Ratio
The total debt ratio is calculated as the ratio of total debts to total assets. It measures how much of the assets are essentially financed by the creditors. Therefore, the higher the ratio, the more is the financial risk.
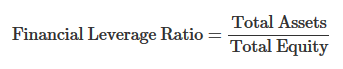
Financial Leverage Ratio
Financial leverage ratio is calculated as the ratio of total assets to total equity. Also, this is an important component in the DuPont model.
Apart from liquidity and solvency ratios, there are also many other ratios such as activity ratios that measure how well a company is able to convert its assets into sales. Then there are turnover ratios that measure of the number of times a company’s inventory, or receivables are replaced/turned over during a given time period. These ratios use data from both income statement and balance sheets.
Calculating Balance Sheet Ratios in Excel
MarketXLS historical data functions allow us to calculate the important balance sheet ratios with a single click. It has inbuilt formulas for all these ratios such as current ratio, debt-equity ratio, etc. This saves you the trouble of manually extracting data from the balance sheets, and aggregating it in excel sheets. Therefore, with MarketXLS, all you need to do is provide the stock symbol, and the year for which you want the ratio, and it will fetch the information for you in one click. In addition, MarketXLS contains the fundamentals data for the past 10 years. We fetch this data using MarketXLS’s historical fundamentals functions.
We calculate these ratios using the following MarketXLS formulas.
| Liquidity Ratios | |
| Current Ratio | =hf_Current_Ratio(Symbol,Year) |
| Quick Ratio | =(hf_Current_Assets(Symbol,Year)-hf_Inventory(Symbol,Year))/hf_Current_Liabilities(Symbol,Year) |
| Solvency Ratios | |
| Debt-to-Equity Ratio | =hf_Debt_to_Equity_Ratio(Symbol,Year) |
| Total Debt Ratio | =hf_Total_Debt(Symbol,Year)/hf_Total_Assets(Symbol,Year) |
| Financial Leverage Ratio | =hf_Total_Assets(Symbol,Year)/hf_Shareholders_Equity(Symbol,Year) |
Balance Sheet Ratios in Excel Template
We’ve created an excel template that calculates the key balance sheet ratios. We have fully automated the template and it calculates the balance sheet ratios for the past three years. All you need to do is input the stock symbol and you will have all the ratios you want for the past three years. You can easily extend the template to calculate more ratios you use while analyzing stocks. Furthermore, MarketXLS ‘hf’ functions contain all the financial statement information. Use this template to calculate practically any financial ratio you want.

I invite you to book a demo with me or my team to save time, enhance your investment research, and streamline your workflows.