
Better Investments, Faster Decisions, Better Research
Meet the #1 Excel-based Investment Research Solution for Serious Investors
Benjamin Graham, popularly known as the ‘father of value investing’, provided an elaborate framework to identify undervalued stocks. he proposed this in his books ‘Security Analyst’ and ‘The Intelligent Investor’. He also proposed a simple intrinsic value formula to identify these underpriced stocks, now known as the Ben Graham Formula. In this article we will learn about what Ben Graham formula is and how we can use it to measure a company’s intrinsic value.
Ben Graham Formula
The Ben Graham formula is a simple and straightforward formula that investors can use to evaluate a stock’s intrinsic value. The stock’s intrinsic value is the key idea behind it. The belief is that the stock market doesn’t really reflect the intrinsic value of the company. The intrinsic value itself is an estimate of a company’s value and depends on both tangible and intangible aspects of the company. We calculate intrinsic value using fundamental analysis. With this view, if the stock price is below the intrinsic value by a significant margin, then the investors should invest the stock for long-term to gain excess returns.
The Ben Graham Formula is provided below:
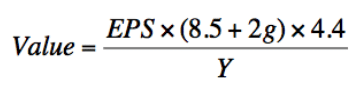
There are four key inputs:
- Value is the intrinsic value that we are calculating
- EPS: The trailing 12-month EPS (Earnings per Share). This helps us adjust EPS to a more normalized number
- 8.5: The constant represents the PE ratio of the company with 0% growth as proposed by Graham. It is reasonable to assume this number to be anywhere between 7 and 8.5.
- g: the company’s long-term (5-10 years) earnings growth rate
- 4.4: The minimum required rate of return. The risk-free rate was 4.4% in around 1962, when this model was introduced
- Y: The current 20-year AAA corporate bond rate
Identifying Under-priced Stocks
Using the Ben Graham Formula, we can calculate Relative Graham Value (RGV) by dividing the stock’s intrinsic value by its stock price. If the RGV is above one, as per theory the stock is undervalued and is a good buy. If the RGV is below 1, then the stock is overvalued and is a good sell.
We should note that many modern investors consider the formula to be too simplistic. Also, they doesn’t reflect our learning in the modern financial theory. However, studies have shown that the approach does work. Just like any other value investing approaches, we should not look at the intrinsic value we calculate using the formula as the absolute fair value of the stock, but rather as an indicator of the value.
The Ben graham Formula also has a drawback that it considers growth rate as an important element. It is important for analyst to exercise care while choosing an appropriate growth rate.
Ben Graham Formula in Excel
We have setup an excel template that we can use to calculate the intrinsic value of a stock using the Ben Graham Formula. The excel template is very flexible and we can extend and customize it to value any stock. You can also make assumptions according to your requirements. The spreadsheet makes use of MarketXLS functions to fetch the various inputs such as EPS, and stock prices.
Better Investments, Faster Decisions, Better Research
Meet the #1 Excel-based Investment Research Solution for Serious Investors
