

For investment professionals, understanding what an ETF fund is means having a methodology to deconstruct any fund, quantify its components, and determine portfolio suitability using Excel.
ETFs, Funds & Alternatives
Expert insights on stock market analysis, investment strategies, and Excel techniques for smarter investing.
Browse articles by topic, arranged in reading order.
For investment professionals, understanding what an ETF fund is means having a methodology to deconstruct any fund, quantify its components, and determine portfolio suitability using Excel.

Black-Litterman, risk parity, factor, and AI portfolio optimization compared, with an Excel workflow using MarketXLS data and the FundXLS Portfolio X-Ray.

How to run portfolio optimization in Excel with MarketXLS functions: portfolio volatility, beta, Sharpe, Sortino, drawdown, VaR and efficient frontier from a ticker and weight range.

Portfolio optimization picks the asset mix with the highest expected return for a chosen level of risk. How Modern Portfolio Theory, the efficient frontier, and key risk metrics work.

Monthly dividend yield is annual yield divided by 12. How to calculate it, and how to build a month-by-month dividend income tracker in Excel with MarketXLS.

Master covered call position management with our comprehensive Excel tracking system. Learn when to roll, close early, and optimize your covered call portfolio using MarketXLS.

Best covered calls are found through systematic screening of stock quality, premium yield, strike selection, and liquidity. Learn how to build a covered call screener in Excel with MarketXLS and find optimal income-generating opportunities.
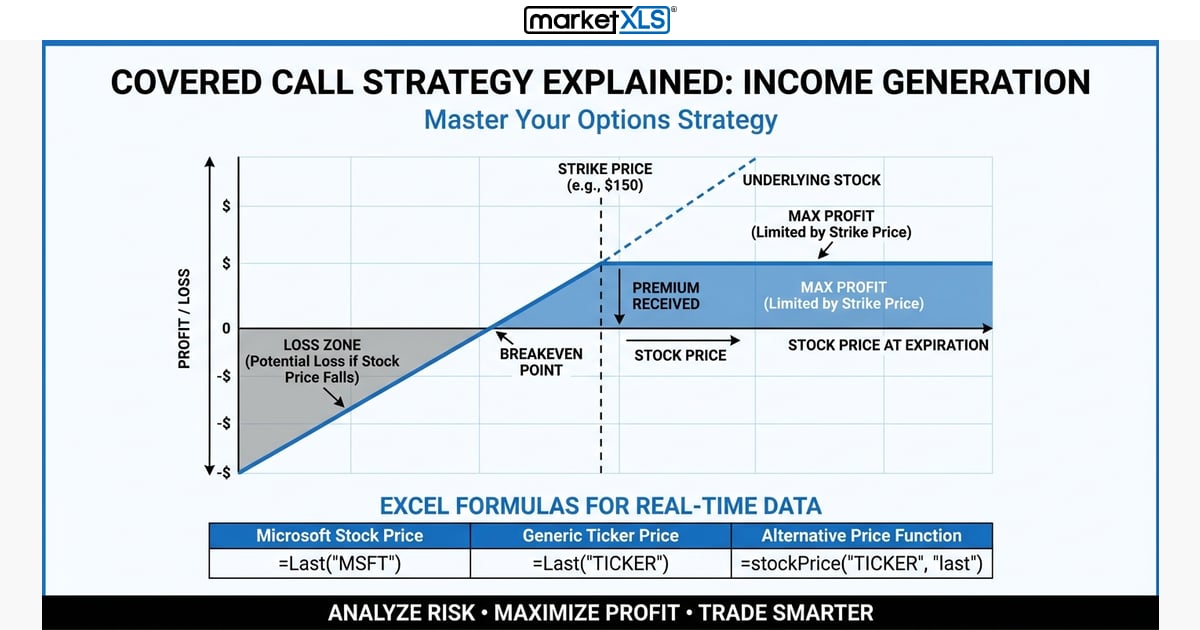
Covered call strategy is the most reliable way to generate recurring income from stocks you already own. Learn step-by-step how to set up, analyze, and manage covered calls using MarketXLS in Excel.

EBITDA Formula in Excel is essential for evaluating company profitability. Learn how to calculate EBITDA manually and with MarketXLS functions, compare it to other metrics, and build valuation models.

Piotroski Score guide covering all 9 F-Score criteria, calculation methods, value investing applications, and stock screening with MarketXLS.

0DTE Theta Decay accelerates dramatically on expiration day. Learn how same-day options lose time value hour by hour, trading strategies to profit from rapid decay, and how to track theta in real time with MarketXLS.

0DTE options strategy explained: how same-day expiration options work, common setups like iron condors and credit spreads, the main risks, and how to analyze them in Excel.

SPX options historical data enables traders to backtest strategies, analyze volatility trends, and study pricing patterns on the S&P 500 Index. Learn how to retrieve and analyze historical SPX options data using MarketXLS Excel functions.

How to get real-time option data in Excel: stream contracts with =QM_Stream_Last, pull chains and Greeks with QM_GetOptionChain and QM_GetOptionQuotesAndGreeks, and which plan you need.
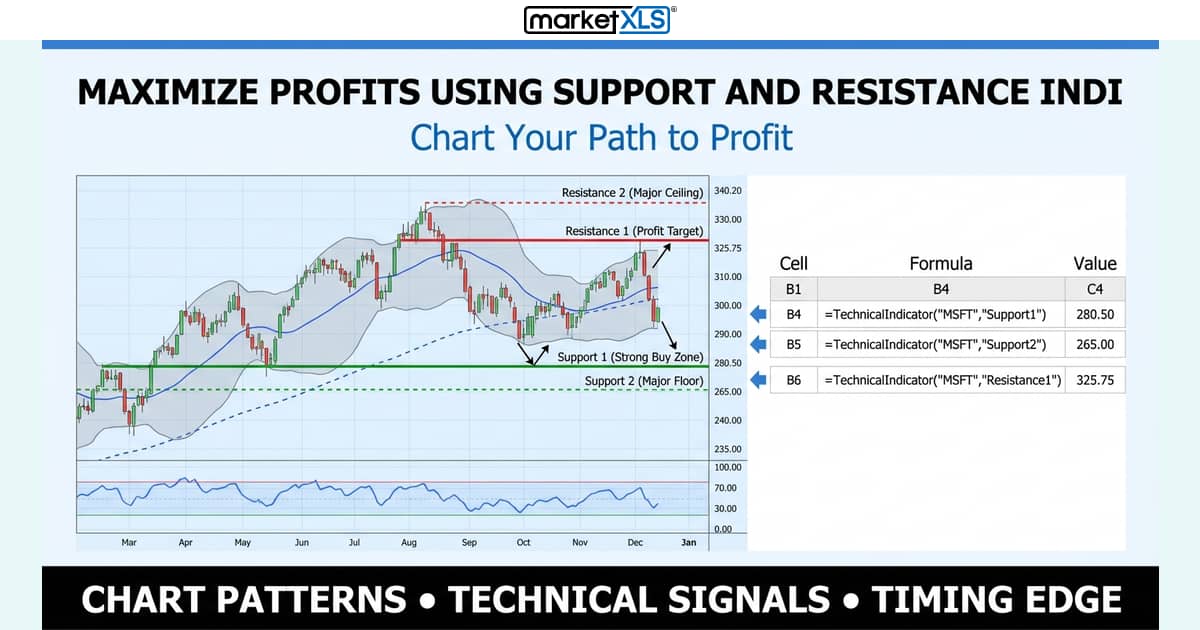
Support and resistance are price levels where a move tends to stall or reverse. How to find them, confirm them with volume and candlesticks, and calculate them in Excel.

Zerodha Brokerage Calculator in Excel helps you compute intraday, delivery, F&O, and commodity trading costs with formulas for STT, GST, SEBI fees, and stamp duty.
Live market data, stock screening, options analytics and portfolio management inside Excel.