Bollinger Bands Trading Strategy

Meet The Ultimate Excel Solution for Investors
- Live Streaming Prices Prices in your Excel
- All historical (intraday) data in your Excel
- Real time option greeks and analytics in your Excel
- Leading data in Excel service for Investment Managers, RIAs, Asset Managers, Financial Analysts, and Individual Investors.
- Easy to use with formulas and pre-made sheets
Bollinger BandsNamed after famous technical analyst John Bollinger in 1983, Bollinger Bands are a notable technical analysis technique used by many investors. Traders use this technique to determine whether a stock is being overbought or oversold. When prices move near the upper band, the more overbought the security is and when the price reaches the lower band, the more oversold it is. Bollinger has 22 rules to follow when using this technique. Here we will discuss some of the prominent factors.
Breakouts Breakouts are often times misunderstood by investors. The great majority of price action occurs within the two bands. Breakouts are when prices are above or below the bands; however, this does not constitute a trade action. Neither direction is a signal to buy or sell; rather the breakout is an anomaly and does not provide a path towards the future movement of the stock.
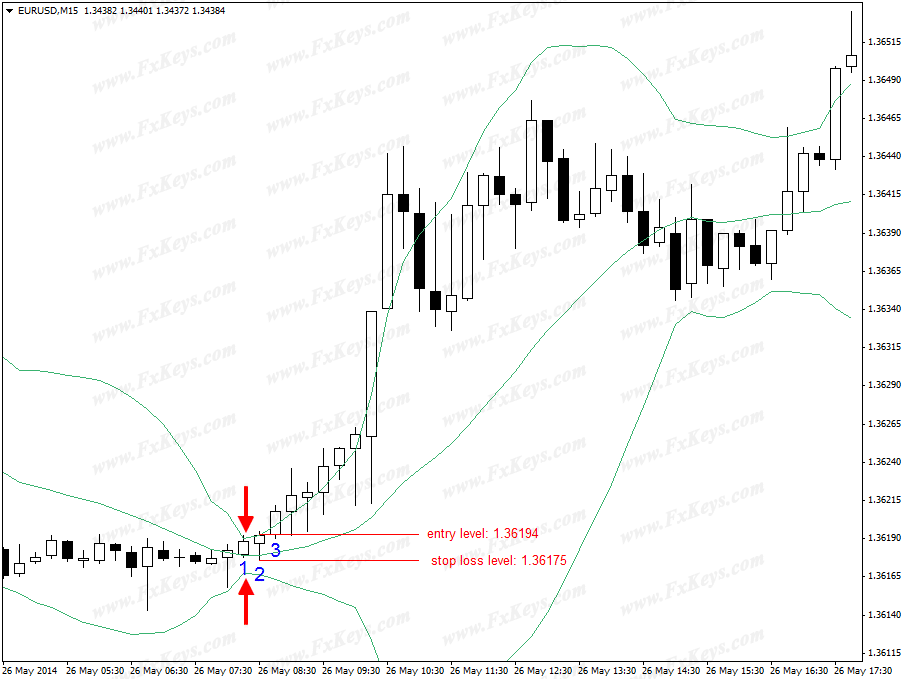
Double BottomThe double bottom approach can be a highly successful strategy when performed correctly. To execute the double bottom, you mark the first time the price touches the lower band, and then wait to see where the next low point occurs. A price that is near or at the low can be a sign of a buying opportunity. With this technique, the second low can express that this is a good time to buy. Then the stock may experience an uptick soon and you were able to buy it at a low price point.
The SqueezeConsidered the most fundamental component of the Bollinger Bands, the squeeze, occurs when the bands come together narrowing the moving average. Traders consider this period a potential opportunity to make trades as a squeeze signals a time of low volatility with the expectation there is greater volatility later. On the other hand, when the bands widen apart the volatility levels subside and traders typically close out of trades.
The Classic M TopThe classic M top certainly received its name based on how the price movement creates the letter “M” on a chart. It occurs when a price soars high just before a sell-off, and then a push towards its previous high. When a chart depicts the classic M top, it is hard for traders to simply predict whether the stock is going to trend upwards or down. However, for many traders, once a stock reaches its second high it is almost always a signal to sell.
Using Bollinger Bands[thrive_lead_lock id=’6598′]Bollinger Bands can be used in several ways to determine the current volatility of a stock, its price movement in relation to its moving average, and as a way of finding a trade opportunity. It is important to remember that when the price touches the upper band that does not robotically mean to sell. This also goes for prices touching the lower band, not automatically displaying a buy signal. On occasions, the price may break out of the upper band and if you sold once the price touched the upper band, then you have missed out on profits. Sometimes it is wiser to wait for a double bottom or a classic M top to form to better gauge its potential trend.
[/thrive_lead_lock]
Calculate Bollinger Band Values with MarketXLLS and plot it
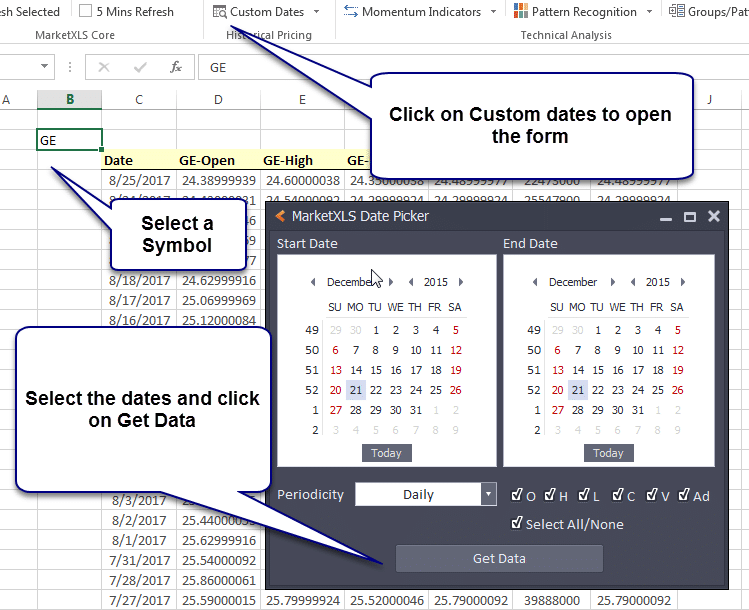
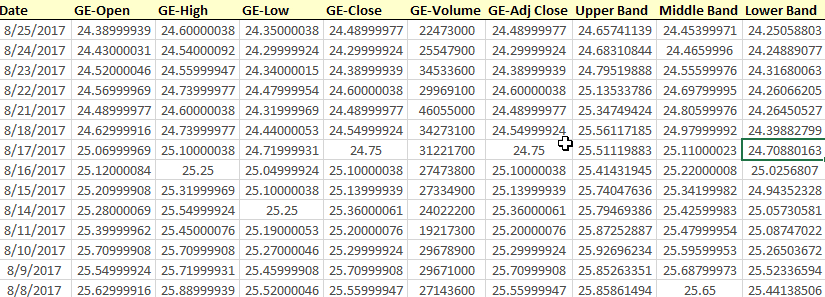
Step 1) Get the Historical prices as shown below…
Step 2) Select Bollinger Bands from the menu and pass the Close price values.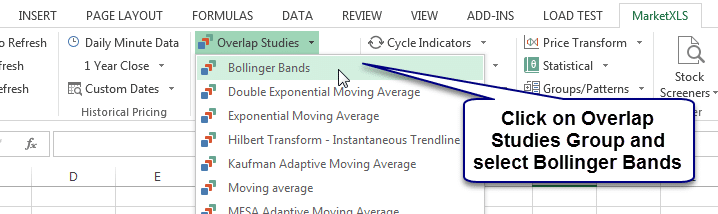
Step 3) Select a cell to post the results and the bollinger band series will be calculated.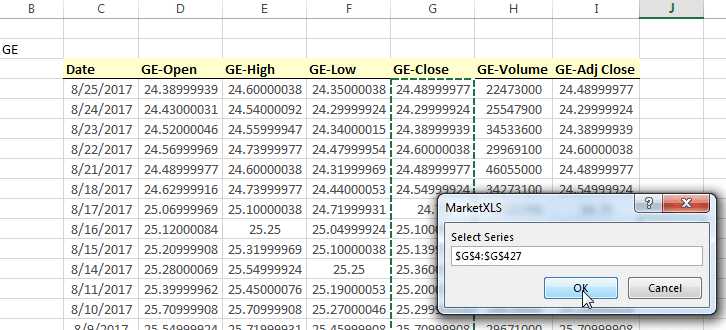
Once, you have the Bollinger band series, you can simply plot it or backtest your trading strategy based on Bollinger Bands.
With MarketXLS, you can simply plot your Excel data and add Bollinger bands while customizing your charts as shown below…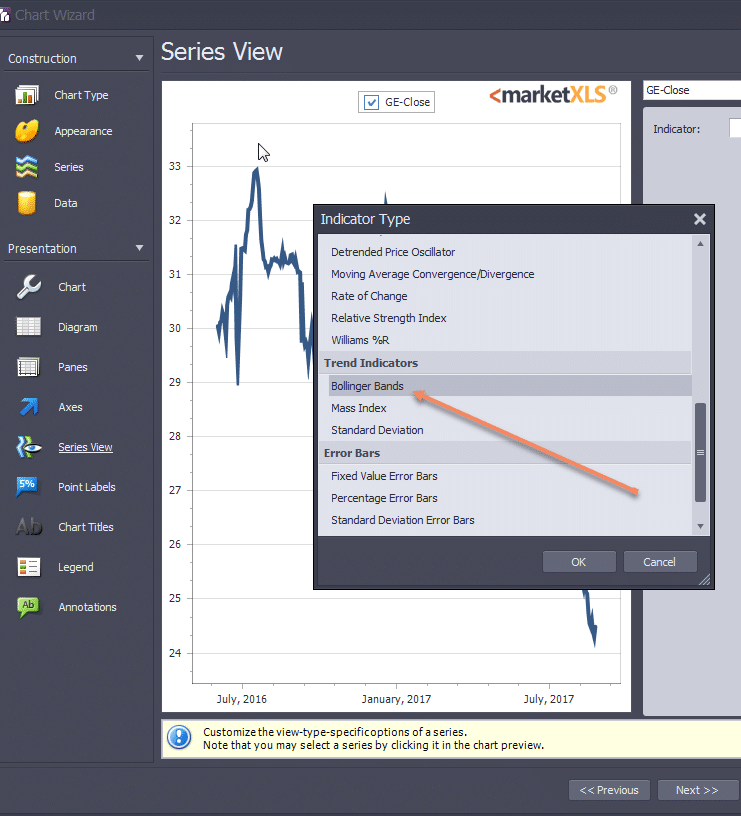
When the price line crosses the either of the higher or the lower band it generally refers to a reversal of the tred.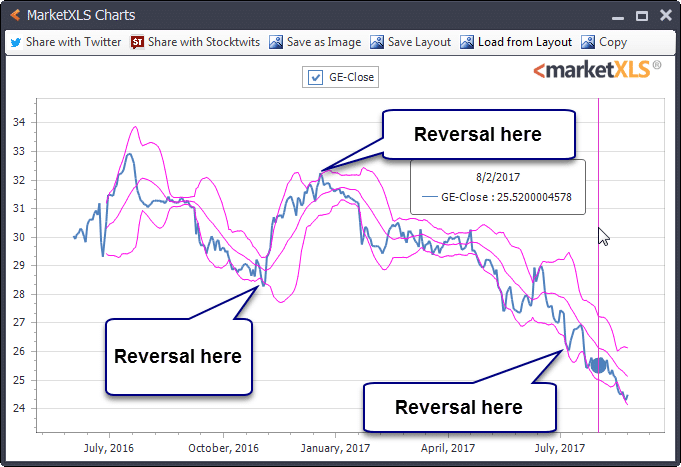
This technique can also be an indicator of beginning and ending of strong trends. Strong trends can cause a rapid increase in volatility. When bands move far apart or incredibly narrow, traders find it necessary to wait out the trend. This interim high volatility can cause major losses on trades.
A trader’s sole system of decision making is not meant to be based on Bollinger Bands. Bands work as a tool to determine price volatility and price trend analysis. Investors should view Bollinger Bands as a method to reveal opportunities of greater chances of trading success.
Since Bollinger Bands are a pure price indicator, using them with other technical analysis, such as volume indicators and market trends, will make this technique much more effective. Certainly, there is no one technique that will provide the very bottom price to buy or top price to sell. However, Bollinger Bands can help maximize your trading decisions.
References : https://www.luckscout.com/what-is-bollinger-band-squeeze-and-how-to-trade-it/http://www.tradeciety.com/bollinger-bands-explained-step-by-step/

I invite you to book a demo with me or my team to save time, enhance your investment research, and streamline your workflows.