Cash Generating Power Ratio

Meet The Ultimate Excel Solution for Investors
- Live Streaming Prices Prices in your Excel
- All historical (intraday) data in your Excel
- Real time option greeks and analytics in your Excel
- Leading data in Excel service for Investment Managers, RIAs, Asset Managers, Financial Analysts, and Individual Investors.
- Easy to use with formulas and pre-made sheets
While performing financial analysis, most analysts first focus on the commonly used balance sheet and income statement ratios. However, such analysis is often incomplete because the ratios calculated from the statement of cash flows can provide significant insights and add tremendous value to any financial analysis, whether it for for picking stocks, raising capital, or for performing a complete going concern analysis. In this article, we will learn about an important cash flow ratio called Cash Generating Power Ratio. We will learn about what this ratio is, how it is calculated and why it is useful.
Cash Generating Power Ratio – Definition and Formula
The Cash Generating Power Ratio is calculated dividing the cash generated from operations of the firm (CFO) by the total cash generated by the firm from all three activities, namely, operations, investments and financing. It measures the proportion of a company’s positive cash flow that comes from operating the business vs. cash from investments or financing activities. We calculate this as follows:
CFO / (CFO + Cash from Investing Inflows + Cash from Financing Inflows)
It’s a powerful ratio at it measures the company’s ability to generate cash from its operations compared to the total cash flows. Not that it only uses the cash inflows from investing and financing, instead of the all investing and financing activities.
Analysts should evaluate the Cash Generating Power Ratio of a company on an annual basis, in addition to comparing these values from one year to the other. A reduction in this ratio over time should be seen as a concern.
How to Calculate Cash Generating Power Ratio
We can calculate Cash Generating Power Ratio by analyzing the Statement of Cash Flows of a company. Here are the steps:
- Start with the Cash Flow from Operations. This figure is directly available in the statement of cash flows.
- Calculate the cash inflows from investing activities. This can include things such as sale of investments and other investing activities.
- Calculate the cash inflows from financing activities. This can include things such as issuance of debt or equity.
Once we have these three figures, we can apply the above mentioned formula to calculate the Cash Generating Power Ratio.
Example – Google
In the following example, we calculate the Cash Generating Power Ratio for Google for the year 2016.
We used MarketXLS to fetch this data. We can get the cash flow and lots of other fundamentals data using MarketXLS historical fundamentals ‘hf’ functions.For example, to get Net Cash Flow from operations, use this formula: =hf_Net_Cash_Flow_from_Operations(“GOOG“,”2016”)
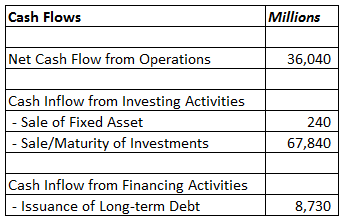
Based on this data, we can calculate the Cash Generating Power Ratio as follows:
= 36040/(36040+240+67840+8730)
= 0.32
Similarly, you can calculate the ratio for any stock to understand their ability to generate cash from operations, before making your investment decision.

I invite you to book a demo with me or my team to save time, enhance your investment research, and streamline your workflows.