Cyclical And Non-Cyclical Stocks (Determining Nature Of A Stock With Marketxls)
")
Meet The Ultimate Excel Solution for Investors
- Live Streaming Prices Prices in your Excel
- All historical (intraday) data in your Excel
- Real time option greeks and analytics in your Excel
- Leading data in Excel service for Investment Managers, RIAs, Asset Managers, Financial Analysts, and Individual Investors.
- Easy to use with formulas and pre-made sheets
Cyclical Industries
Cyclical industries are those that are economically sensitive. This means they follow the ups and downs of the economy as a whole – becoming profitable during periods of prosperity and inactive during downturns.
This cycle is largely down to consumer spending. If a good or service is seen as a discretionary expense – an optional cost – then the companies involved would usually only see profitability if consumers have sufficient incomes.
What are Cyclical and Non-Cyclical Stocks?
Cyclical stocks are units of ownership in these companies whose profits depend on the business cycle. The price of cyclical stocks usually rise in periods of economic boom – and can even outperform the wider market. But their value usually falls during downturns, in line with sales and profits.
Common examples of cyclical industries include automobile manufacturers, luxury goods producers, airlines, hotels and restaurants. When consumers have excess capital, they are more likely to make extravagant purchases or go on holidays, but during times of economic hardship, consumers tend to stop spending and start saving.
Non-cyclical stocks – also known as defensive stocks – are the shares of companies that tend to be profitable regardless of the state of the economy. Unlike cyclical stocks, they produce the goods and services that society can’t do without, such as utilities or food companies. This means that the price of defensive stocks will likely remain stable, or even rise, during periods of increased volatility. As a result, investors and traders often use defensive stocks as safe havens or to hedge against falling markets. Non-cyclical stocks repeatedly outperform the market when economic growth slows.
Non-cyclical stocks examples include stocks of companies manufacturing and selling fast-moving consumer goods, petrol, or electricity, among other things. These products continue to be in demand irrespective of the state of the economy, because people need these products or services on a daily or a regular basis.
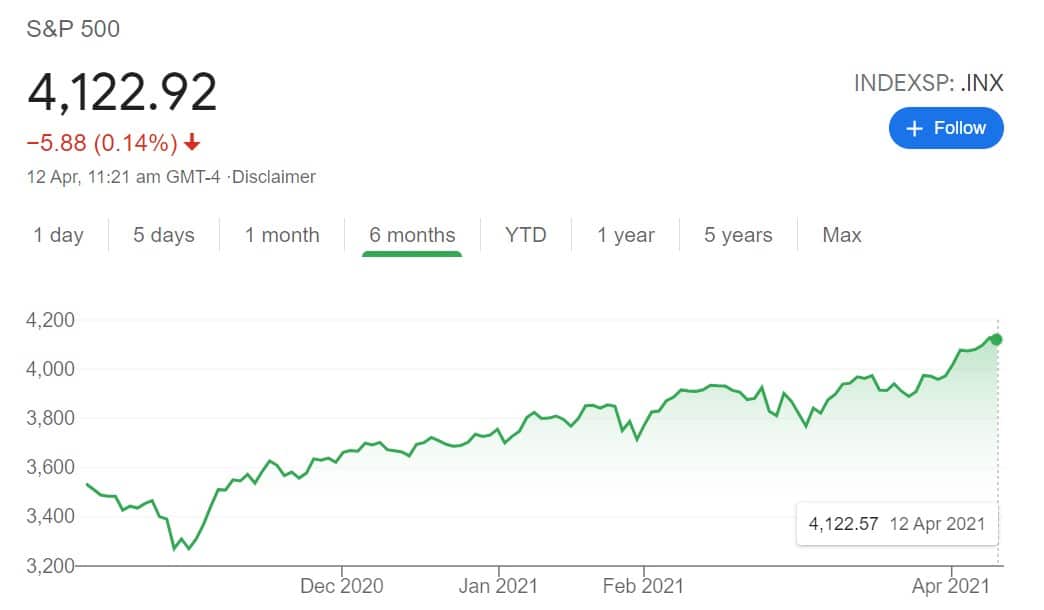
Comparison of Stocks with S&P 500 Market Index:
To illustrate the differences between cyclical & non-cyclical stocks, we’ve compared the prices of American Airlines Group Inc. (Airlines Industry) and Walmart Inc. (Consumer Defensive Industry) to the S&P 500 Market Index – a common benchmark for the health of the US economy- from Oct 2020 to Apr 2021, when lockdown restrictions started to ease out worldwide.
 AAL stock chart” width=”318″ height=”193″ />
 WMT stock chart” width=”320″ height=”190″ />
From the price charts, we can see that when S&P 500 is constantly rising in points, the value of AAL shares also rises because of the lifting up of bans from air travel & an increase in the number of flights and therefore an increase in operating activities. The opening up of the economy has given a push to the airline industry. In contrast, the scenario is not the same when it comes to WMT stock. The price falls even when the benchmark market index is rising as sales growth was tepid at 6.7% for the same period. The coronavirus pandemic has not affected the business of Walmart as it’s a consumer defensive stock, so the sales remained somewhat stagnant pre and post-lockdowns. While for a cyclical stock like AAL, the sales got a major push and so it followed an upward trend like the S&P 500 index.
Different Ways to Determine Nature of a Stock:
Beta value
Beta value is a measure of a stock’s volatility in comparison to the rest of the market. Usually, a benchmark, such as a stock index, is used to assess a company’s deviation from the norm.
If a stock has a beta of 1, then its volatility is equal to the rest of the market. A beta of less than one would mean the stock is less volatile than the market – which is likely the case with defensive stocks. And a beta of more than one would mean the stock has a higher level of volatility, which is usually a good indicator of a cyclical stock.
For example, if a cyclical stock has a beta of 1.5. This would mean for every 10% move in the underlying benchmark, the stock would have moved by 15%.
Earnings per share
Cyclical stocks’ earnings per share (EPS) can vary significantly from quarter to quarter because their profit and loss are so sensitive to economic health.
Price-to-earnings Ratio
One can look at the price-to-earnings ratio (P/E ratio), which compares EPS to the stock’s value. A low P/E ratio compared to competitors would mean that you’re paying less for each pound of profit generated – suggesting that the company is undervalued. Cyclical stocks tend to have a far lower P/E ratio as a result of fluctuations in both their EPS and stock price.
How to Determine Nature of a Stock Using MarketXLS Template?
MarketXLS software is a one-stop solution for the analysis of your entire investments. It provides a host of functions like eps, various ratios, key fundamentals, historical data and much more to assess the value of your investments.
For the sake of clarity, here, we will be using the same stocks mentioned above in the article to know their beta values and compare them with the benchmark market index. The beta value calculated will be in correspondence to the default S&P 500 index which is considered as an indicator of economic health.
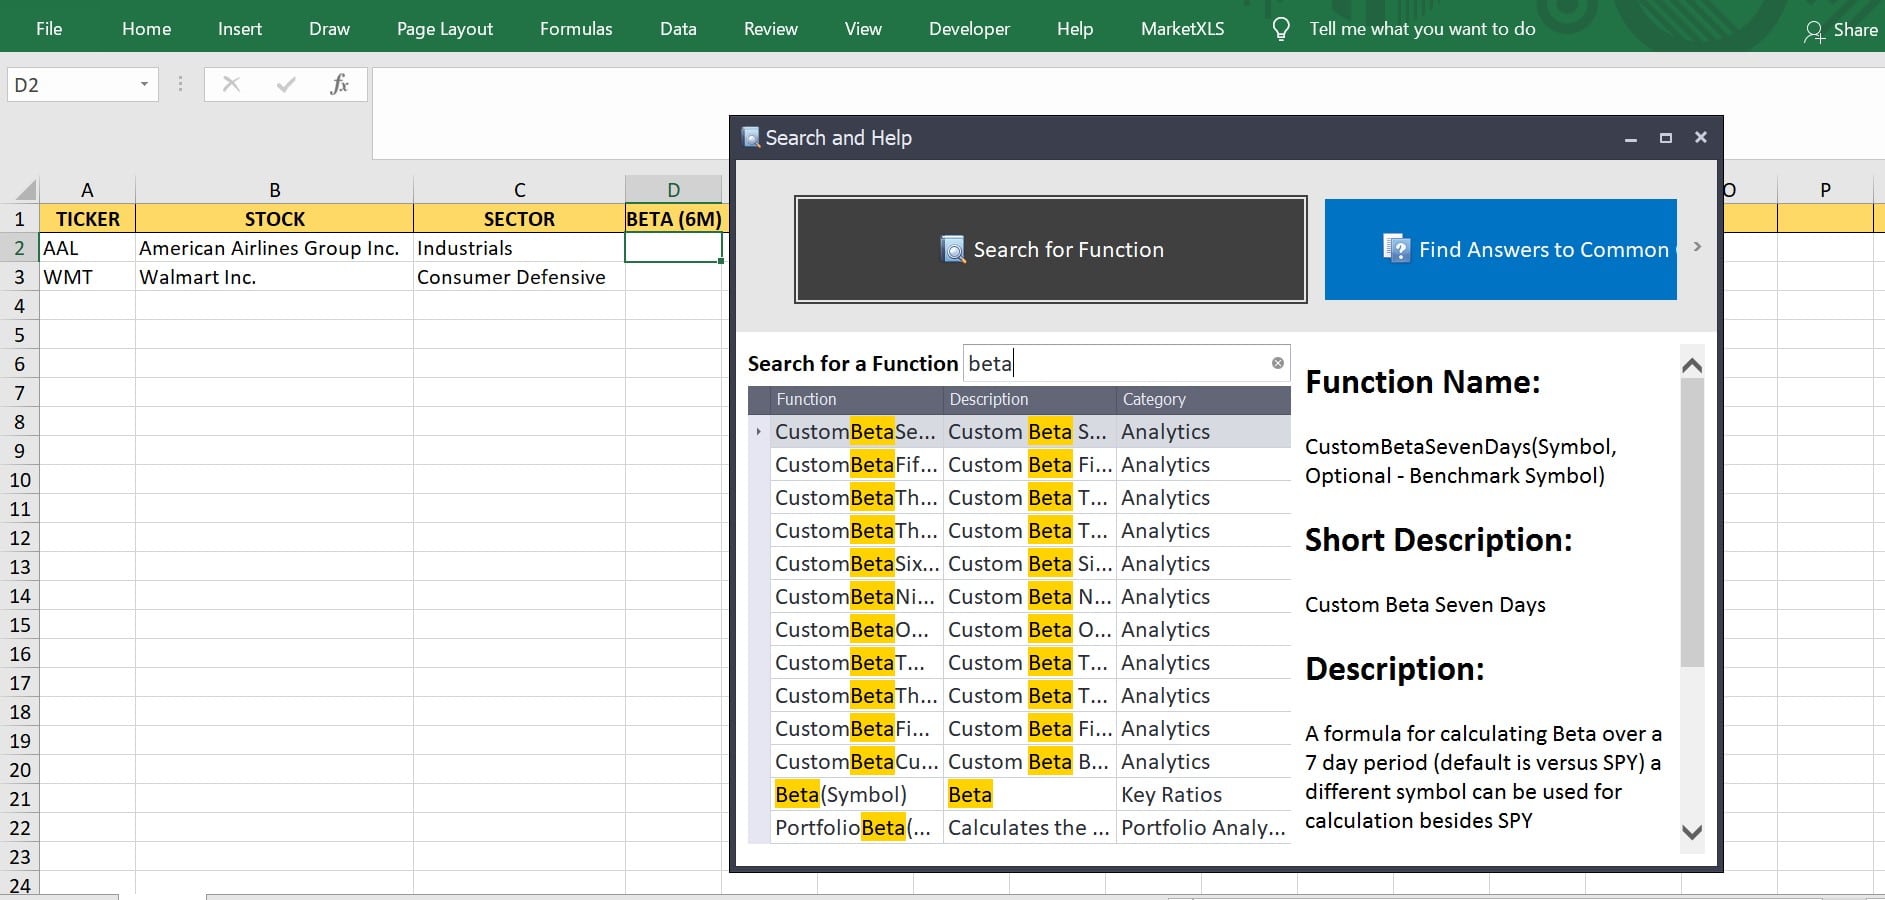
Step 1: Go to the MarketXLS tab in the ribbon and click on search and help. Type beta in the search panel. A no. of beta functions will appear with their descriptions like beta for 7 days, beta for a year, beta for 6 months, etc. Search for the one you need.
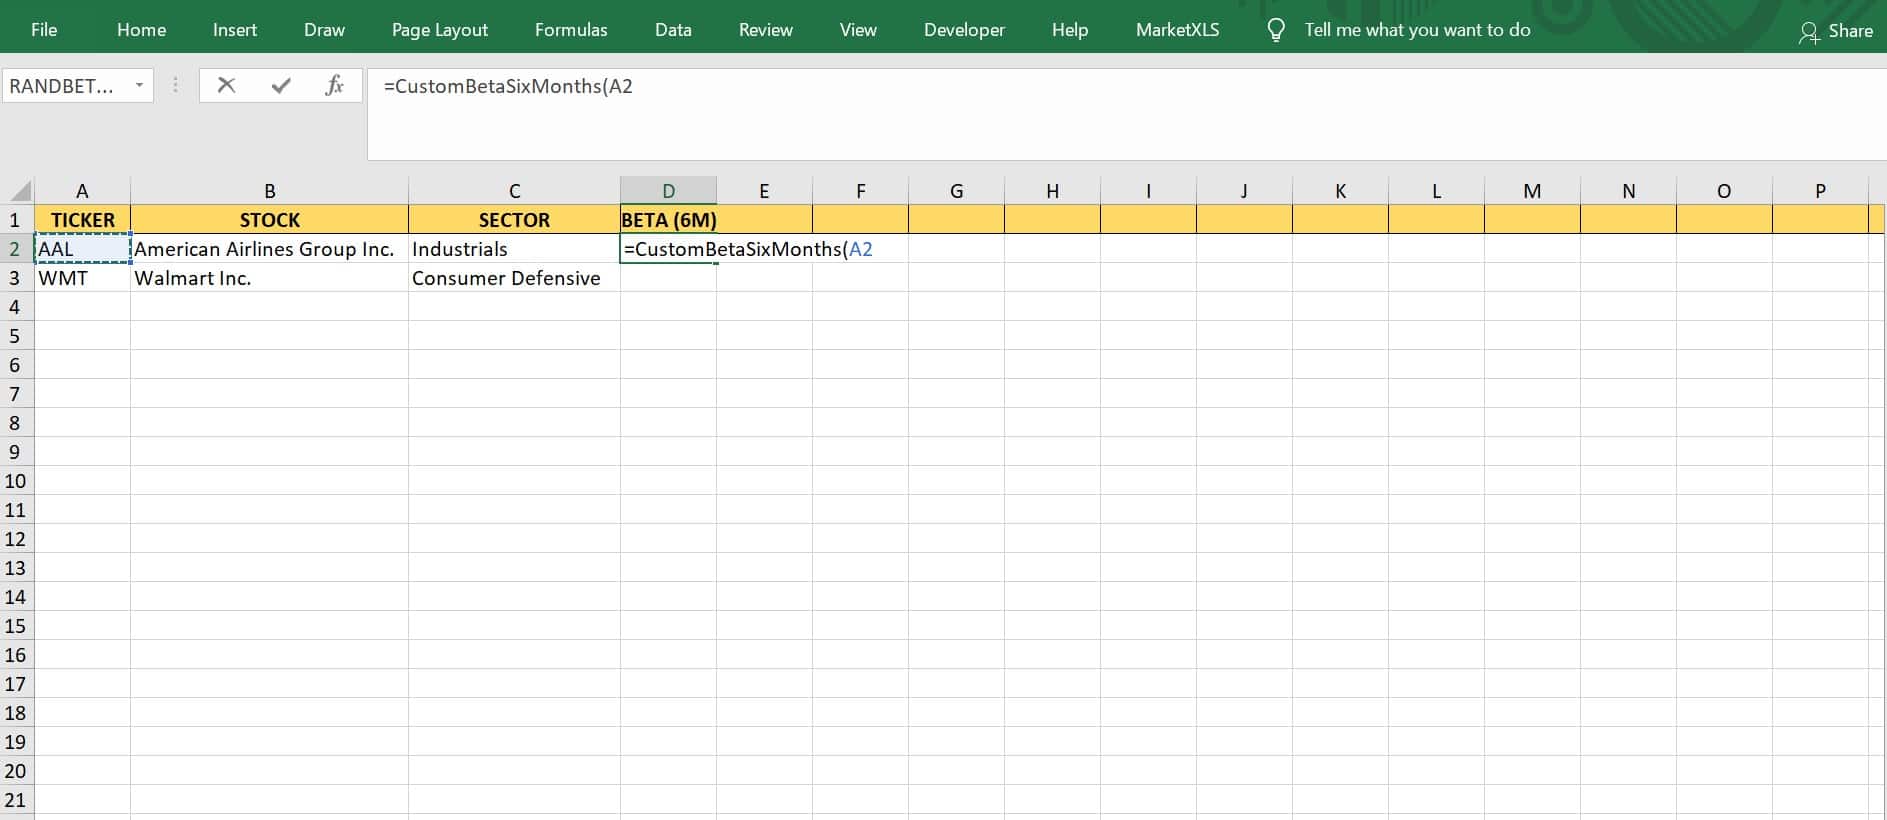
Step 2: Here I have selected custom beta for 6 months as I want to know what their beta values have been in the last 6 months in relation to the S&P 500 market index. Put the function, select the cell with the ticker name of that stock and press Enter.
Step 3: The beta value will appear for the stock. Use flash fill to get the same for all the stocks. To know other important ratios and fundamental data, go to the MarketXLS tab, then to fundamental analysis and select key ratios or fundamental data as per your need.
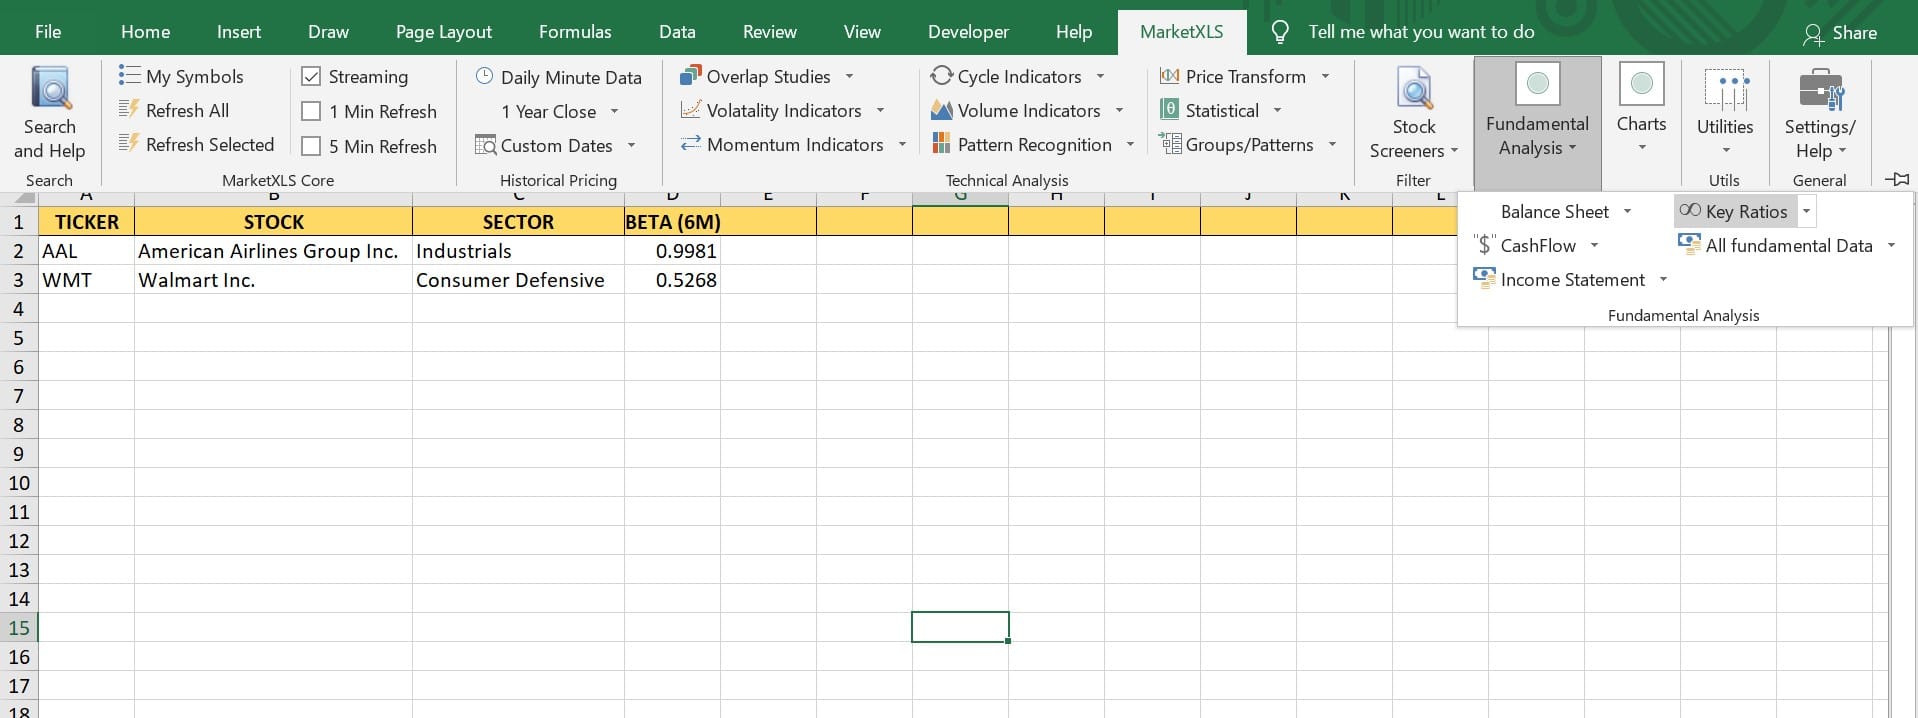
As we can see the beta for AAL stock is very close to 1 which indicates the impact of economic health on the company. Thus it’s quite clear that this is a cyclical stock.
The beta for WMT stock is much less than 1, indicating that the economic health has not impacted the operations of this company and thus making it a non-cyclical stock.
Diversification can help manage Cyclical Stock Risk:
Cyclical stocks are known for having a better rate of growth than other stocks during periods of economic strength. While non-cyclical industries tend to have stable profits over time, cyclical stocks experience extreme booms and outperform their benchmarks in economic upturns.
To build a portfolio with cyclical stocks – or any stocks for that matter – you need to diversify your exposure. This would mean trading a mix of cyclical and defensive stocks – as well as other asset classes.
During a period of economic prosperity, both types of stocks have the potential to earn you profit. However, if a period of economic downturn did occur, then your defensive stocks would likely offset some of the loss caused by any cyclical stocks you held a position on.
Disclaimer:
All trademarks referenced are the property of their respective owners. Other trademarks and trade names may be used in this document to refer to either the entity claiming the marks and names or their products. MarketXLS disclaims any proprietary interest in trademarks and trade names other than its own, or affiliation with the trademark owners.
None of the content published on marketxls.com constitutes a recommendation that any particular security, portfolio of securities, transaction, or investment strategy is suitable for any specific person. The author is not offering any professional advice of any kind. The reader should consult a professional financial advisor to determine their suitability for any strategies discussed herein. The article is written for helping users collect the required information from various sources deemed to be an authority in their content. The trademarks if any are the property of their owners and no representations are made.
Reference:
https://www.ig.com/en/trading-strategies/cyclical-stocks-and-industries-what-you-need-to-know-200703
Image Source:

I invite you to book a demo with me or my team to save time, enhance your investment research, and streamline your workflows.