What is debit spreads?
Let’s first begin with how options are traded. Just like trading stocks, it is all about minimizing risk and maximizing profits. To forge the ultimate strategy, a trader always indulges in buying and selling options at multiple strike prices. This is what spreads are, the range of the strike prices. However, unlike credit spreads, where you get money to open a trade, in debit spreads you actually pay to open a trade. This may leave you scratching your head but it will be clear in subsequent paragraphs.
Trading with marketXLS
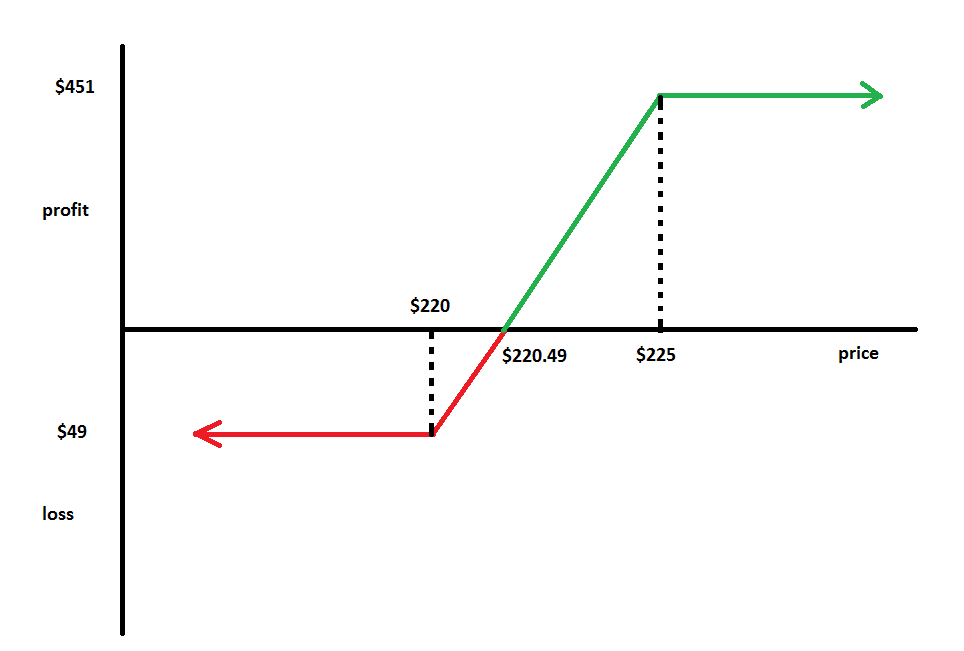
Below is a template provided by marketXLS to trade options. With this template, you can not only import option chains but also track your trades in real-time. This is an example of a bull call spread. In this example, a net debit spread of $49 is created as you can see in the net investment section. Here a spread of $5 is created between strikes of $220 and $225 but you can adjust them according to your own convenience. You can also adjust the expiry and the underlying and get the respective last, ask bid and spread values.
Max, min, breakeven
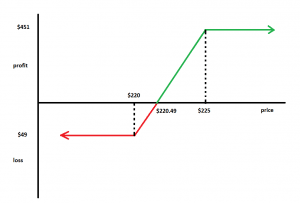
Let’s understand the different scenarios associated with the above example with the help of a graph. Here units mean contract (100 shares).
The bear put spread will also be similar with respect to positions, maximum profits, and losses. The only difference would be in the direction of trades. You would be making put trades in a bear put spread.
The bottom line
The risks and profits are both limited in this strategy. However, if you see in the above example, the maximum profit is about 10%. To sum up, this strategy is for traders who are risk-averse and are skeptical about a stock’s movement in the near future.
Disclosure
None of the content published on marketxls.com constitutes a recommendation that any particular security, portfolio of securities, transaction, or investment strategy is suitable for any specific person.
The author is not offering any professional advice of any kind. The reader should consult a professional financial advisor to determine their suitability for any strategies discussed herein.
the article is written for helping users collect the required information from various sources deemed to be an authority in their content. The trademarks if any are the property of their owners and no representations are made.
References
Images from marketXLS.com
More about debit spreads here
More about credit spreads here
More options strategies here


