What is implied volatility?
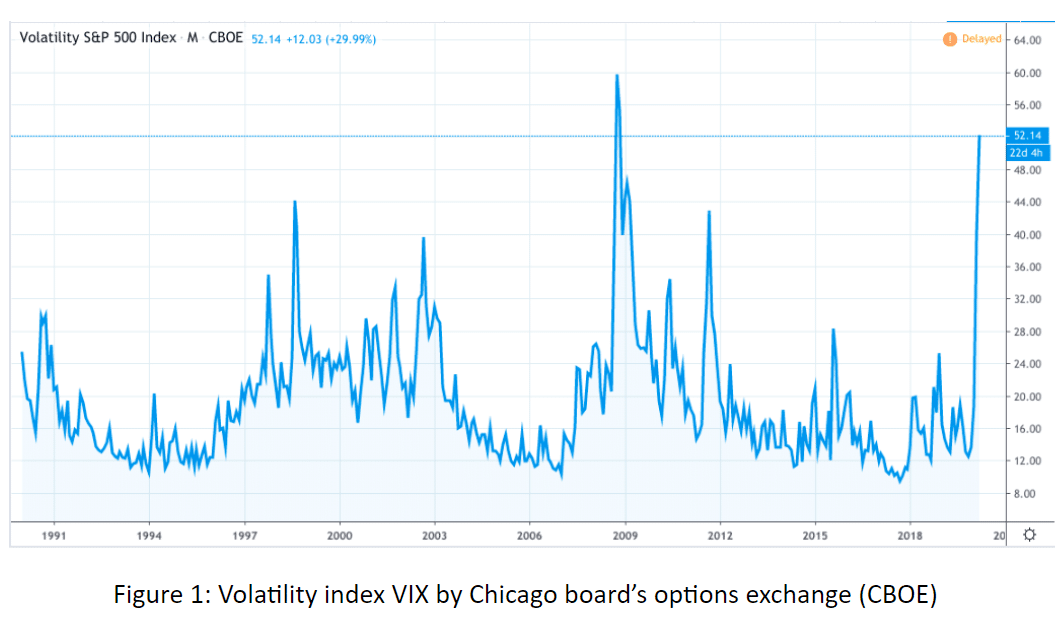
As the name itself suggests, Implied volatility is the anticipated volatility of a market in the near future. Various parameters are used to predict volatility, the most significant ones being the strike price of an option and its expiry date. Normally, volatility can be calculated by simple statistical tools like standard deviation and Beta but the calculation of implied volatility requires advanced methods like the volatility surface. There is also an index for implied volatility called the CBOE volatility index or popularly known as VIX. It was developed by CBOE global markets (erstwhile, Chicago boards options exchange) which gives an idea about volatility for the next 30 days based on market sentiments. It is derived from the stock prices of the S&P 500 index. VIX index is used by many options traders to get a gist of the volatility spanning over a month.
Impact of volatility on option prices
Volatility has a huge impact on the option premium. Option prices tend to increase with rising volatility as option buyers profit from volatility and there is more demand for options as volatility increases. Buyers have a premium to pay and only a high move in prices can earn them profits. Option volatility is denoted by the Greek symbol Vega, which reflects the price movement in price due to a 1% rise in volatility. Below is a theoretical example:
How to use implied volatility?
Volatility can be used irrespective of the direction a stock is going to move in. As long as stock is making or expected to make huge moves, it’s beneficial. The best part is both the sellers and the buyers can benefit from volatility. Below are some simple strategies based on implied volatility:
Impact of the Earnings announcement
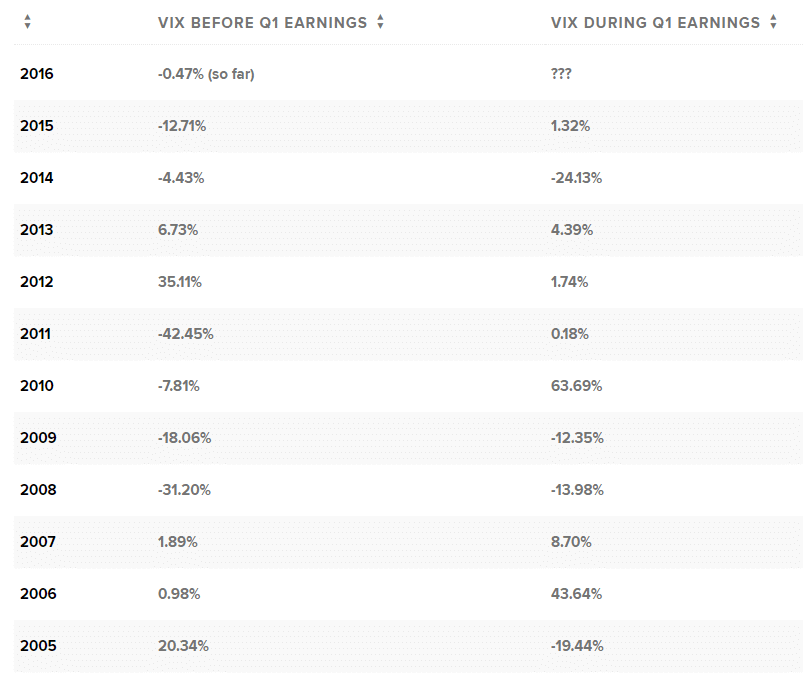
Volatility is a result of anticipation, no matter what the outcome. Markets tend to be volatile whenever there is a result underway. Be it election results, or be it financial results of a company. Traders often wait for quarterly or annual results to trade the volatility it entails. Sometimes markets become volatile even before the declaration of results. Normally, it’s not advisable to trade earnings announcement but as long as there is volatility, one can play safe using pairs like put and call at the same time, as mentioned above. The most preferred strategies are straddles and strangles. However, the main challenge lies in the timing of the VIX index with respect to the earnings of a company. Because the market can react to the earnings of different companies in different ways or may not react at all. In the image below, you can see dramatic changes in volatility across various years, the most notable being 43.64% in 2006 and 63.69% in 2010.
Below is the VIX index on and around the publishing date of the earnings of apple as of 26th September 2020 also known as the big day, as stock market enthusiasts like to call it.

In the case of Apple, the volatility spiked a bit on 23rd September, 3 days before the results. It can vary from company to company. Hence, it is always advisable to adopt a proper strategy keeping in mind both the profits and risks.
Disclaimer
None of the content published on marketxls.com constitutes a recommendation that any particular security, portfolio of securities, transaction, or investment strategy is suitable for any specific person. The author is not offering any professional advice of any kind. The reader should consult a professional financial advisor to determine their suitability for any strategies discussed herein.
References:
More about implied volatility here.
For the volatility chart, click here.
For more about trading earnings announcement, click here.
For more about the effect of earnings on IV, click here.
