
Elliott Wave Theory was developed by Ralph Nelson Elliott that is used to describe the stock price movements. It is based on participants’ behavior on the hypothesis that stock prices move between optimism and pessimism of all market participants’ psychology. Thus, wide swings in the participants’ psychology make stock prices move in a particular pattern/trend.
It is a subjective theory where not all traders interpret the theory the same way, and it identifies several different types of waves. The Fundamental Concept is that stock prices move in clear trends, classified into Dominant trends (Five wave patterns) and Corrective trends (Three wave patterns).
The Fundamental Concept
Elliott Wave theory advocates that stock prices move in clear trends. These trends can be classified in mainly two parts:
A. Dominant trend (Five wave pattern)
B. Corrective trend (Three wave pattern)
Dominant Trend (Five Wave Pattern)
The Dominant trend consists of five waves which can be classified in either direction, up or down. The waves are known as Impulsive waves when they are up and then advancing or down and declining. The waves are known as Corrective waves when up and then declining or down and advancing.
The dominant trend of each wave has its characteristic; when markets are rising the wave 1 is a weak rally with only a few traders participating in the market. It mainly happens because fundamental news is still negative, and above all, previous trends which were declining are still considered vital to be in force.
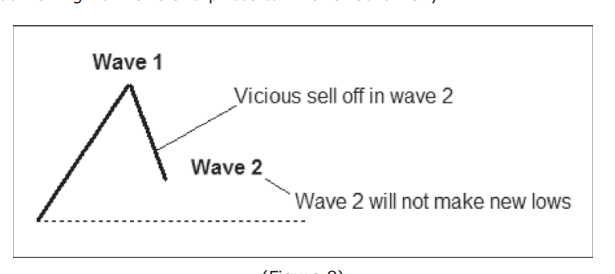
Wave 2: Once wave 1 is over, wave 2 is a very vicious (sharp) sell-off. But wave 2 never outstretches the starting point of wave 1. So wave 2 ends without making new lows, and prices turn for another rally.

Wave 3: There is a slow rally in the initial stage of wave 3 as market participants are not convinced about the rally. One can see many short positions are there in the market and get squared off as and when markets rally and finally close when the top of wave 1 is crossed. When the top of wave 1 is crossed, market participants are convinced about the rally. It is when there is sudden buy-side interest in the market. Wave 3 is the largest and most powerful wave of the dominant trend.
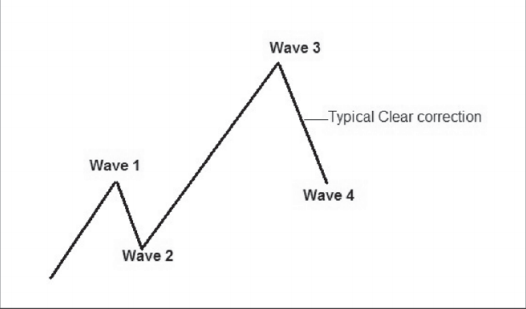
Wave 4: When traders who were long from the lower levels take profits, wave 3 finally ends, and profit-taking starts. Wave 4 is just a correction on volume lesser than wave 3. The majority of the market participants are convinced that the trend is up even while profit-taking is on.

Wave 5: Prices make new highs above wave 3, but volumes are usually lesser than that in wave 3. There is a lack of strength in wave 5 compared to the one witnessed in wave 3, but markets finally top out and enter a new phase.
When Markets Are Declining
Wave 1 is a minor correction with only a few traders participating in the market.
 DLOuwz-Yvow2CE” alt=”Wave 1″/>
Wave 2 is a strong rally after the 1st wave is over. However, it never extends beyond the starting point of wave 1. Thus, wave 2 finally ends without making new highs, and prices start declining again.
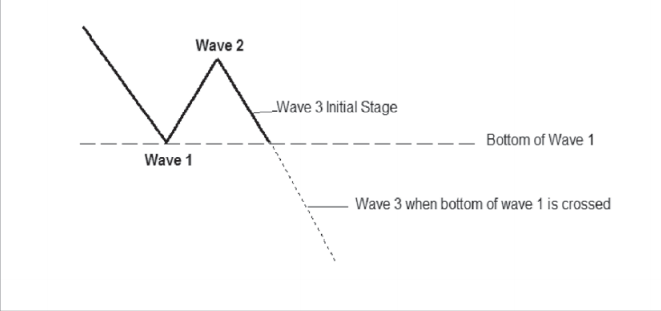
Wave 3: Initially, there is a slow decline as market participants are not convinced about the decline. Many buy-side positions are there in the market, and these get squared off as and when markets decline, these positions are closed when the bottom of wave 1 is crossed. When the bottom of wave 1 has crossed, market participants are convinced about the decline, which leads to a sudden sell-side interest in the market. Wave 3 is known to be the largest and most powerful wave of the dominant trend.

Wave 4: Wave 3 ends as traders who were short from the higher levels take profit; hence profit taking starts. Wave 4 is a clear pull back on lesser volume than wave 3. While profit-taking is on, the majority of the market participants are convinced that trend is down. There are two schools of thought here to trade Wave 4. One is to sell on a rally if the potential ahead for wave 5 is understood. Alternatively, one can wait for wave 4 to end and sell when the market declines again.

Wave 5: It is the final wave of the dominant trend. Although prices make new lows below wave 3, volumes are usually lesser than volume in wave 3.Wave 5 lacks weakness found in wave 3 declines, and finally, markets bottoms out and enter a new phase.
Corrective Trend (Three Wave Pattern)
The corrective trend consists of three waves. The three-wave corrective trend starts when the five-wave dominant trend ends.
Aftermarket rallies in a primary 5 wave sequence, the market top is made, and markets enter a new phase, i.e., three-wave downward corrective phase.
Characteristic of Corrective Waves after market rallies in a basic five wave sequence

Wave A:
It is the beginning of a new bear market.
- Fundamental news is still positive.
- The fact that markets can decline is not readily accepted by everyone.
Wave B: Wave B is a small rally which gives the feeling that Bull Run has again started, but prices fail to make new high and typical volume characteristic here is that Volume in Wave B is lesser than Wave A. Wave C: Here prices again start declining, and volume also picks up, and it’s in Wave C that everyone realizes that market decline is likely to continue and hence market participation on the sell-side increases.
Characteristic of Corrective Waves after market declines in a basic five wave sequence

Wave A:
- Wave A is the beginning of a new bull market.
- The real news is still negative.
- Nobody is ready to accept the fact that markets could rally.
Wave B: Wave B is a slight decline which gives the feeling that decline has again started, but prices fail to make a new low, and the typical volume characteristic here is that Volume in Wave B is lesser than Wave A.
Wave C: Here, prices again start rising, and volume also picks up, and it’s in Wave C that everyone realizes that the market rally is likely to continue; hence market participation on the buy-side increases.
Combining five-wave dominant sequences with a three-wave corrective sequence completes the basic fundamental concept behind Elliott’s Theory.
Disclaimer
All trademarks referenced are the property of their respective owners. Other trademarks and trade names may be used in this document to refer to either the entity claiming the marks and names or their products. MarketXLS disclaims any proprietary interest in trademarks and trade names other than its own, or affiliation with the trademark owners.
None of the content published on marketxls.com constitutes a recommendation that any particular security, portfolio of securities, transaction, or investment strategy is suitable for any specific person. The author is not offering any professional advice of any kind. The reader should consult a professional financial advisor to determine their suitability for any strategies discussed herein. The article is written for helping users collect the required information from various sources deemed to be an authority in their content. The trademarks if any are the property of their owners and no representations are made.
References
