Piotroski F Score Screener – Meaning And Criteria Explained

Meet The Ultimate Excel Solution for Investors
- Live Streaming Prices Prices in your Excel
- All historical (intraday) data in your Excel
- Real time option greeks and analytics in your Excel
- Leading data in Excel service for Investment Managers, RIAs, Asset Managers, Financial Analysts, and Individual Investors.
- Easy to use with formulas and pre-made sheets
Piotroski F Score in Stocks
Definition
The F score in stocks is also known as the Piotroski F-score because it is named after a Chicago-based accounting professor named Joseph Piotroski, who founded it.
It estimates the strength of a firm’s financial position based on nine criteria. It is a distinct score between zero and nine. It is used to actuate the best value stocks.
It is based on the concept of Value Investing. We calculate the F-score using nine fundamental parameters about the stock. For each parameter, if the parameter meets the criteria, we award a score of 1.
According to Joseph Piotroski, the stocks whose F-score comes out to be nine are regarded as the best, and the stock whose F-score comes out to be 0 is considered to be the worst and not worth investing in. Stocks with a score of less than three are considered to be weak, and stocks with a score of more than seven are considered to be comparatively strong.
In this article, we will learn about what F-score is and how to calculate Piotroski F-score in Excel using the ready-to-use template provided by MarketXLS.
Basis/ Parameters of calculating the score
For digging deep, first, let us understand what the components of the score are.
The score is broken down into the following divisions/criteria:
1) Profitability
2) Leverage, Liquidity, and Source of Funds
3) Operational Efficiency
Profitability criterion includes:
• Positive Net Income (N.I > 0)
• Positive Return on Assets in the current year (ROA > 0)
• Positive Cash Flow from Operating Activities in the current year (CFO > 0)
• Operational Cash Flow greater than Net Income (CFO > N.I)
Leverage, Liquidity, and Source of Funds criteria include:
• Lower ratio of long term debt compared to the previous year – Leverage
• Higher current ratio this year compared to the previous year – Liquidity
• No issue of new shares in the last year – Source of Funds
Operational Efficiency criteria include:
• A higher gross margin compared to the previous year
• A higher asset turnover ratio compared to last year
Calculating the F-score in MarketXLS
MarketXLS has a ready-to-use template for calculating the Piotroski F-score.
It makes use of fundamental information available in financial statements. Since MarketXLS provides all the required fundamentals information for stocks, we can calculate Piotroski F-score in Excel using data fetched using MarketXLS.
Let’s finally take a look at how we can do it.
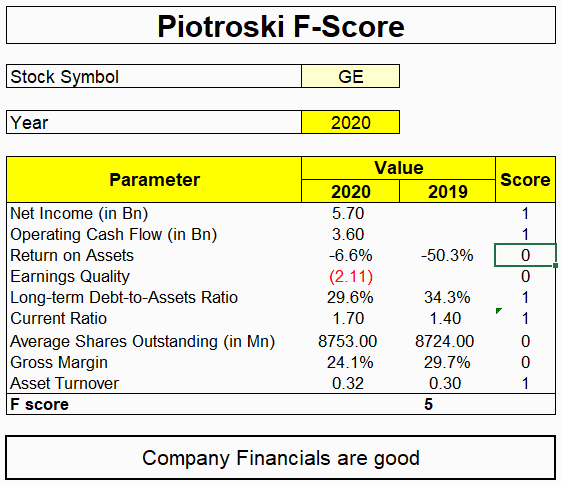
We have taken the ‘GE’ (General Electric) stock in our example and 2020 as our year of consideration. You have to enter the Stock Ticker in cell C4 and the current year in cell C6 of this sheet to get the result. Other results will be calculated automatically by the template and will return the result in cell B21.
https://marketxls.com/marketplace/product/piotroski-f-score-template/
The following is the scoring criteria for GE stock:
Profitability:
• 2020 Net income(in Bn) = 5.70 (1 point)
• 2020 Operating Cash Flow(in Bn) = 3.60 (1 point)
• 2020 Return on Assets = -6.6% (0 point)
• Earnings Quality (Operating Cash Flow – Net Income) = 2.11 (0 point)
Leverage:
• 2020 Long term Debt-to-Assets ratio = 29.6% < 2019 Long term Debt-to-Assets ratio = 34.3% (1 point)
• 2020 Current Ratio = 1.70 > 2019 Current Ratio = 1.40 (1 point)
• Average Shares Outstanding(in Mn) = 8753 (0 point)
Note: From Average Shares Outstanding, we can determine whether new shares were issued in the current year. If the Average Shares Outstanding of the current year are greater than that of the previous year, then it is concluded that new shares have been issued.
Efficiency:
• 2020 Gross Margin = 24.1% < 2019 Gross Margin = 29.7% (0 point)
• 2020 Asset Turnover = 0.32 > 2019 Asset Turnover = 0.30 (1 point)
Therefore, the total F-score of the stock ‘GE’ for the year 2020 would be 5 points.
Hence the result in cell B21 would appear as ‘Company Financials are good.’
(The result entered is an excel generated statement. The author is not offering any professional advice of any kind. The reader should consult a professional financial advisor to determine their suitability for any strategies discussed herein.)
Past Performance of the Score
The Piotroski F-Score has been the only positive screener that has consistently done well over time despite 2018 market conditions. The end of November results show it at 8.32% vs. 2.9% for the S&P.
The Piotroski score method would have seen a 23% annual return between 1976 and 1996 if the expected winners were bought and expected losers shorted.
Conclusion
You can use the Piotroski F-score as a supplement, along with other screening strategies.
The idea behind the Piotroski F-Score is straightforward – Value Investing. It uses historical data to separate strong stocks from weak stocks. Since not all stocks are value stocks, the Piotroski Score can help you find the difference between them and facilitate you in investing and diversifying your portfolio.
But, of course, a look at the past results wouldn’t determine the future of that particular stock.
For more such useful information, please visit https://marketxls.com/.
Disclaimer
None of the content published on marketxls.com constitutes a recommendation that any particular security, portfolio of securities, transaction, or investment strategy is suitable for any specific person.
The author is not offering any professional advice of any kind. The reader should consult a professional financial advisor to determine their suitability for any strategies discussed herein.
The article is written to help users collect the required information from various sources deemed to be an authority in their content. The trademarks, if any, are the property of their owners, and no representations are made. All trademarks referenced are the property of their respective owners. Other trademarks and trade names may be used in this document to refer to either the entity claiming the marks and names or their products. MarketXLS disclaims any proprietary interest in trademarks and trade names other than its own or affiliation with the trademark owner.
Reference
https://www.investopedia.com/terms/p/piotroski-score.asp

I invite you to book a demo with me or my team to save time, enhance your investment research, and streamline your workflows.